

Question: 4.16 Table 4.10, which is the Sore Throat data file at the text website, shows results of a study about y = whether a patient
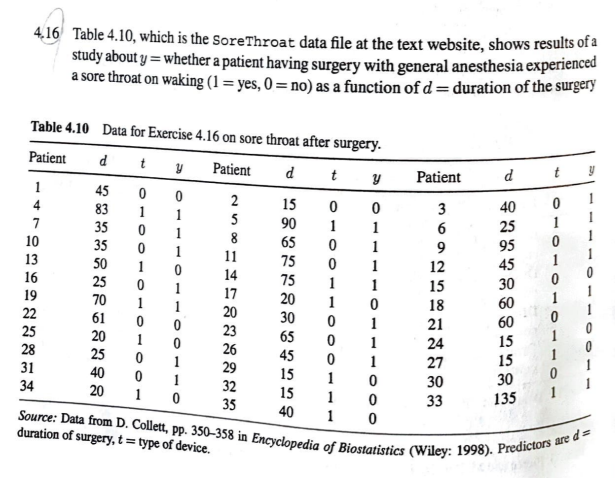
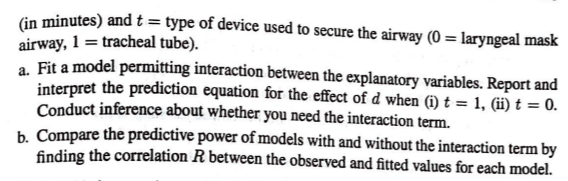
4.16 Table 4.10, which is the Sore Throat data file at the text website, shows results of a study about y = whether a patient having surgery with general anesthesia experience a sore throat on waking (1 = yes, O=no) as a function of d=duration of the surgery Table 4.10 Patient 9 Data for Exercise 4.16 on sore throat after surgery. d t Y Patient Patient d d t t Patient d y t Patie 45 0 0 2 15 00 3400 831 1 90 1 1 6 35 0 1 8 65 0 1 9 0 1 12 14 1 1 15 2010 18 30 0 1 21 65 0 1 24 25 0 0 1 201 151 033 135 0 15 1 0 40 Source: Data from D. Collett, pp. 350-358 in Enevelopedia of Riostatistics (Wiley: duration of surgery, t = type of device. 98). Predictors are da Tin minutes) and t = type of device used to secure the airway (0 = laryngeal mask airway, 1 = tracheal tube). Fit a model permitting interaction between the explanatory variables. Report and interpret the prediction equation for the effect of d when (i) t = 1, (ii) t = 0. Conduct inference about whether you need the interaction term. h Compare the predictive power of models with and without the interaction term by finding the correlation R between the observed and fitted values for each model
Step by Step Solution
There are 3 Steps involved in it

Get step-by-step solutions from verified subject matter experts