

Question: 4:18 PM Sat Jun 4 . . . 15% 4:18 PM Sat Jun 4 00 Q oo x 8 of 17 Chapter 3 Assignment Chapter


4:18 PM Sat Jun 4 . . . 15%
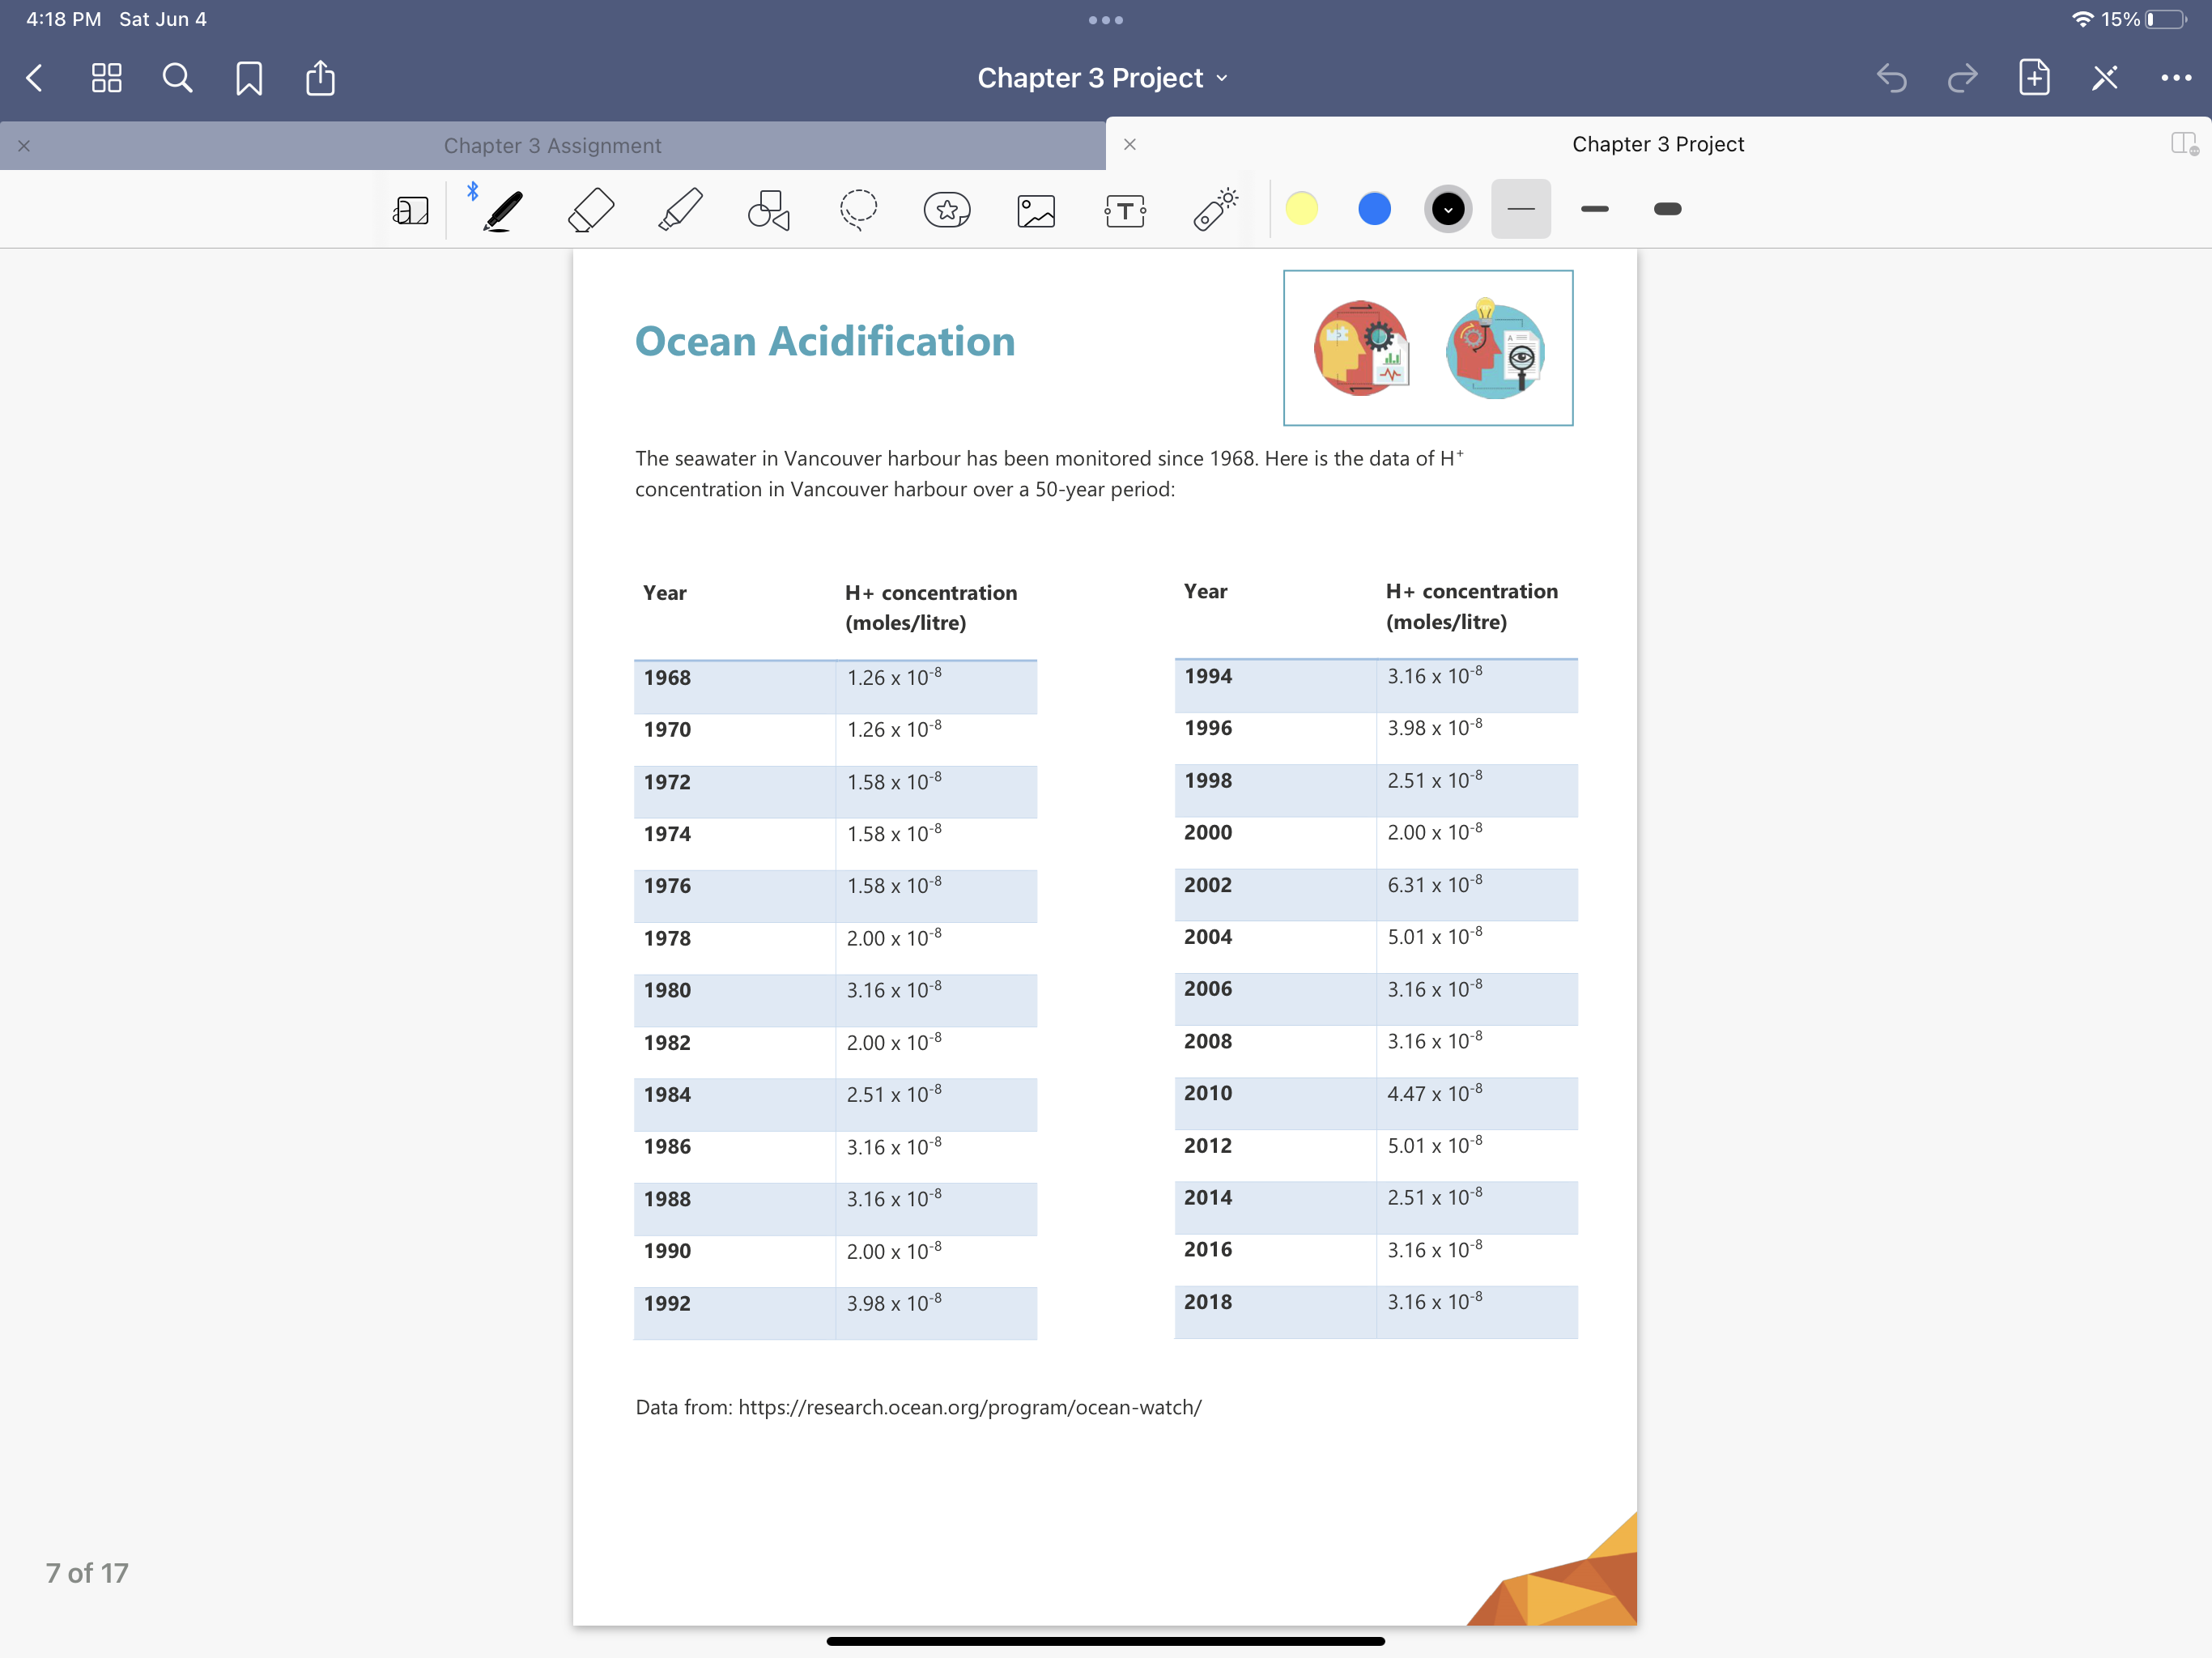
4:18 PM Sat Jun 4 00 Q oo x 8 of 17 Chapter 3 Assignment Chapter 3 Project 00 Chapter 3 Project You might find it useful to use a spreadsheet program like Excel or Google Sheets to help you with the graphing and calculations needed in this project. For your graphs, ensure that you have the correct axes and graph titles. 2. Create a graph to represent the H+ concentration of Vancouver harbour from 1968 to 2018. Paste a screenshot of your graph here: Convert the H+ values to pH values using the equation you derived in the Introduction. Show one sample calculation here:
Step by Step Solution
There are 3 Steps involved in it

Get step-by-step solutions from verified subject matter experts