

Question: 4:19 [1] ? E & myopenmath.com w JUTOLIUIT | 2 ~ 7 1hr59mins X & 0/1pt O 4 O Details FICO credit score is used
![4:19 [1] ? E & myopenmath.com w JUTOLIUIT | 2 ~](https://dsd5zvtm8ll6.cloudfront.net/si.experts.images/questions/2024/10/671c154a00397_705671c1549d461a.jpg)
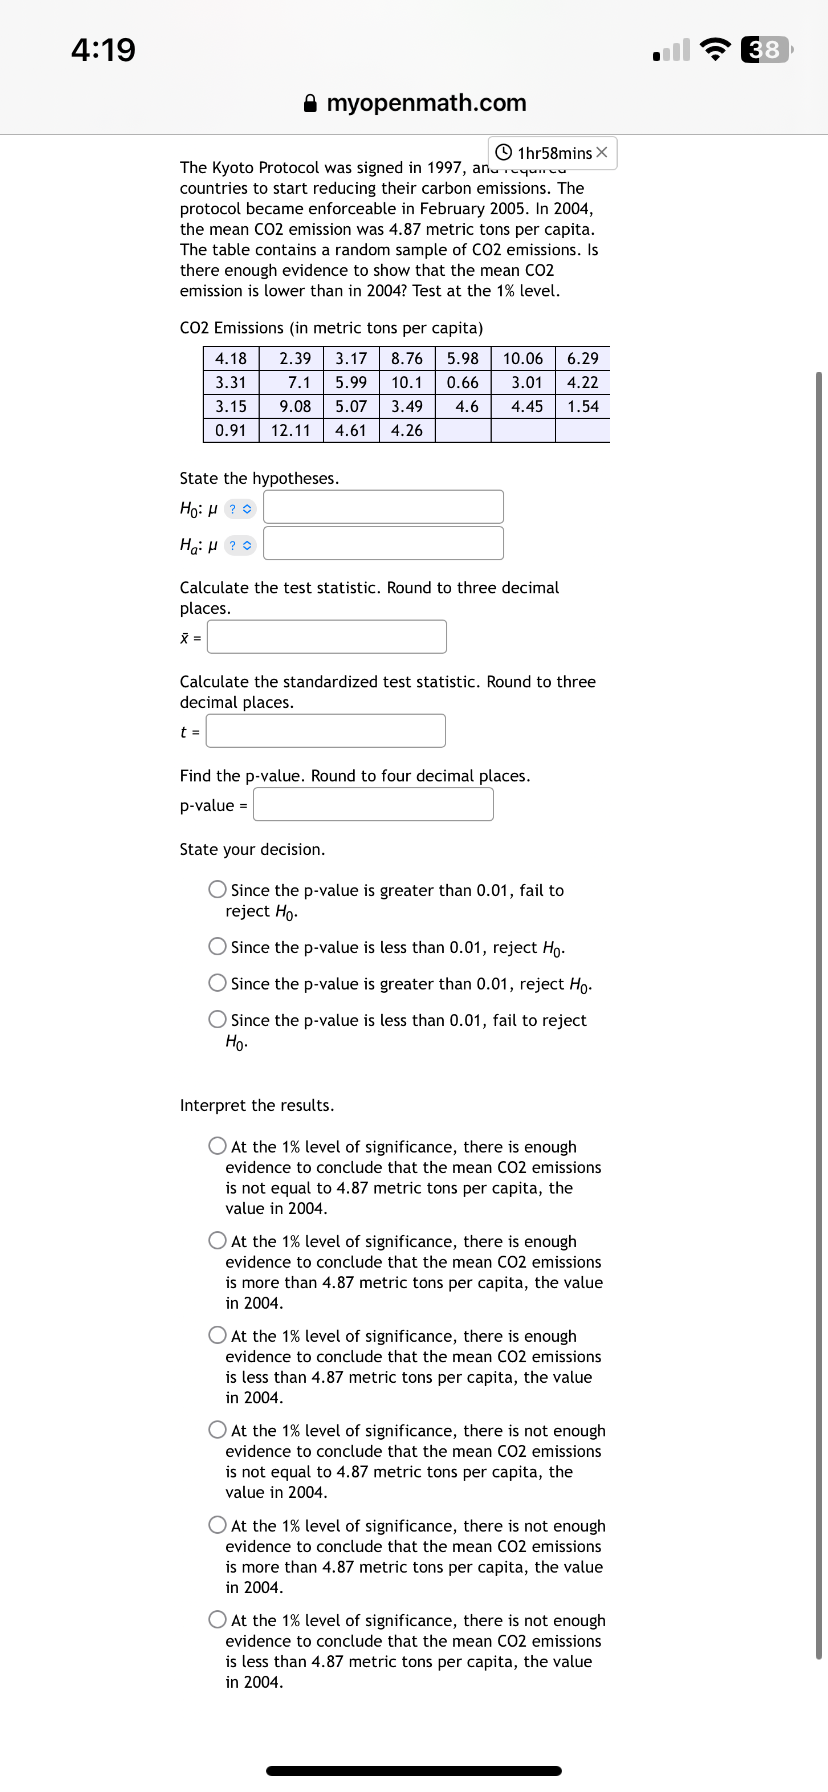


4:19 [1] ? E & myopenmath.com w JUTOLIUIT | 2 ~ 7 1hr59mins X & 0/1pt O 4 O Details FICO credit score is used by banks and other lenders to determine whether someone is a good credit risk. Scores range from 300 to 850, with a score of 720 or more indicating that a person is a very good credit risk. An economist wants to know if the average FICO credit score for those with a business degree is higher than 720. They find a simple random sample of 83 people with business degrees had an average FICO credit score of 732.5 with a standard deviation of 73. Can the economist conclude that the true average FICO credit score for those with a business degree is more than a 720? Use a 5% significance to test Round to the fourth as needed H()Z Select an answer & Select an answer p2 You obtain a sample from the first population with 555 successes and 143 failures. You obtain a sample from the second population with 163 successes and 54 failures. For this test, you should NOT use the continuity correction, and you should use the normal distribution as an approximation for the binomial distribution. What is the critical value for this test? (Report answer accurate to three decimal places.) critical value = | | What is the test statistic for this sample? (Report answer accurate to three decimal places.) test statistic = The test statistic is... (O in the critical region (O not in the critical region This test statistic leads to a decision to... O reject the null (O accept the null () fail to reject the null As such, the final conclusion is that... O There is sufficient evidence to warrant rejection of the claim that the first population proportion is greater than the second population proportion. () There is not sufficient evidence to warrant rejection of the claim that the first population proportion is greater than the second population proportion. (O The sample data support the claim that the first population proportion is greater than the second population proportion. (O There is nat sufficient sample evidence to support the claim that the first population proportion is greater than the second population proportion. Check Answer 9) 4 19 & myopenmath.com . 1hr58mins X The Kyoto Protocol was signed in 1997, an. cqunww countries to start reducing their carbon emissions. The protocol became enforceable in February 2005. In 2004, the mean CO2 emission was 4.87 metric tons per capita. The table contains a random sample of CO2 emissions. Is there enough evidence to show that the mean CO2 emission is lower than in 20047 Test at the 1% level. 02 Emissions (in metric tons per capita) 4.18 2.39 | 3.7 | 8.76 | 5.98 | 10.06 | 6.29 At 7.1 | 599 | 10.1 | 0.66 3.01 | 4.22 3.15 9.08 | 5.07 | 3.49 4.6 4.45 | 1.54 0.91 | 12.11 | 4.61 | 4.26 State the hypotheses. Hp:p 78 ' | Hgp 2o ' | Calculate the test statistic. Round to three decimal plac_es. %= | 1 Calculate the standardized test statistic. Round to three decimal places. & 0/1pt 4 O Details Out of 200 people sampled, 24 had kids. Based on this, construct a 90% confidence interval for the true population proportion of people with kids. Give your answers as decimals, to three places
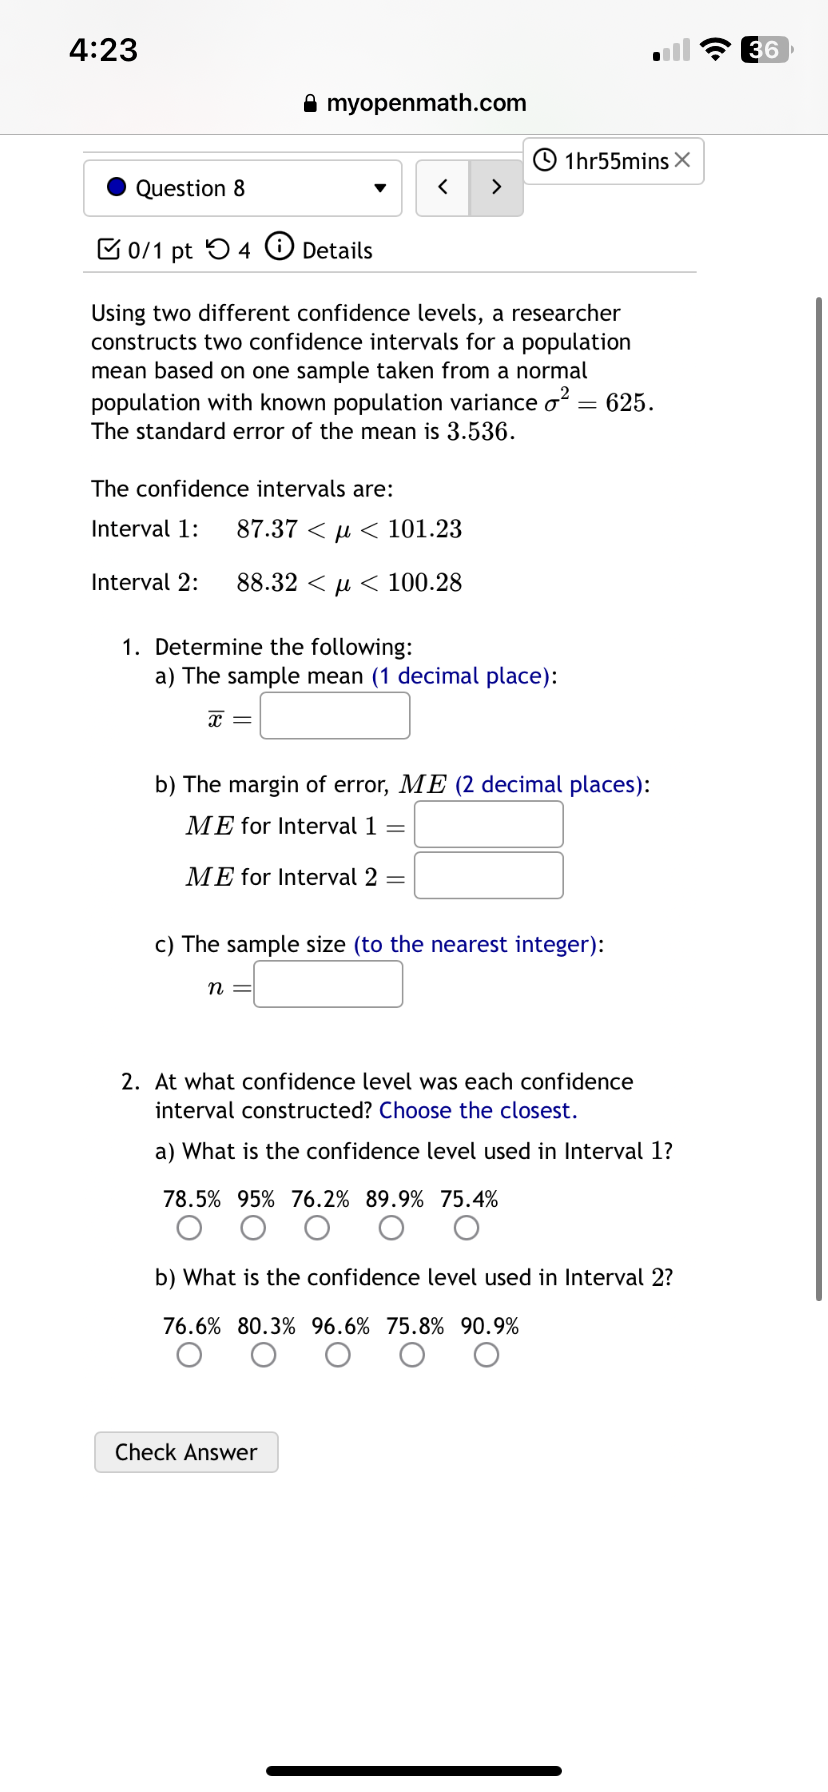
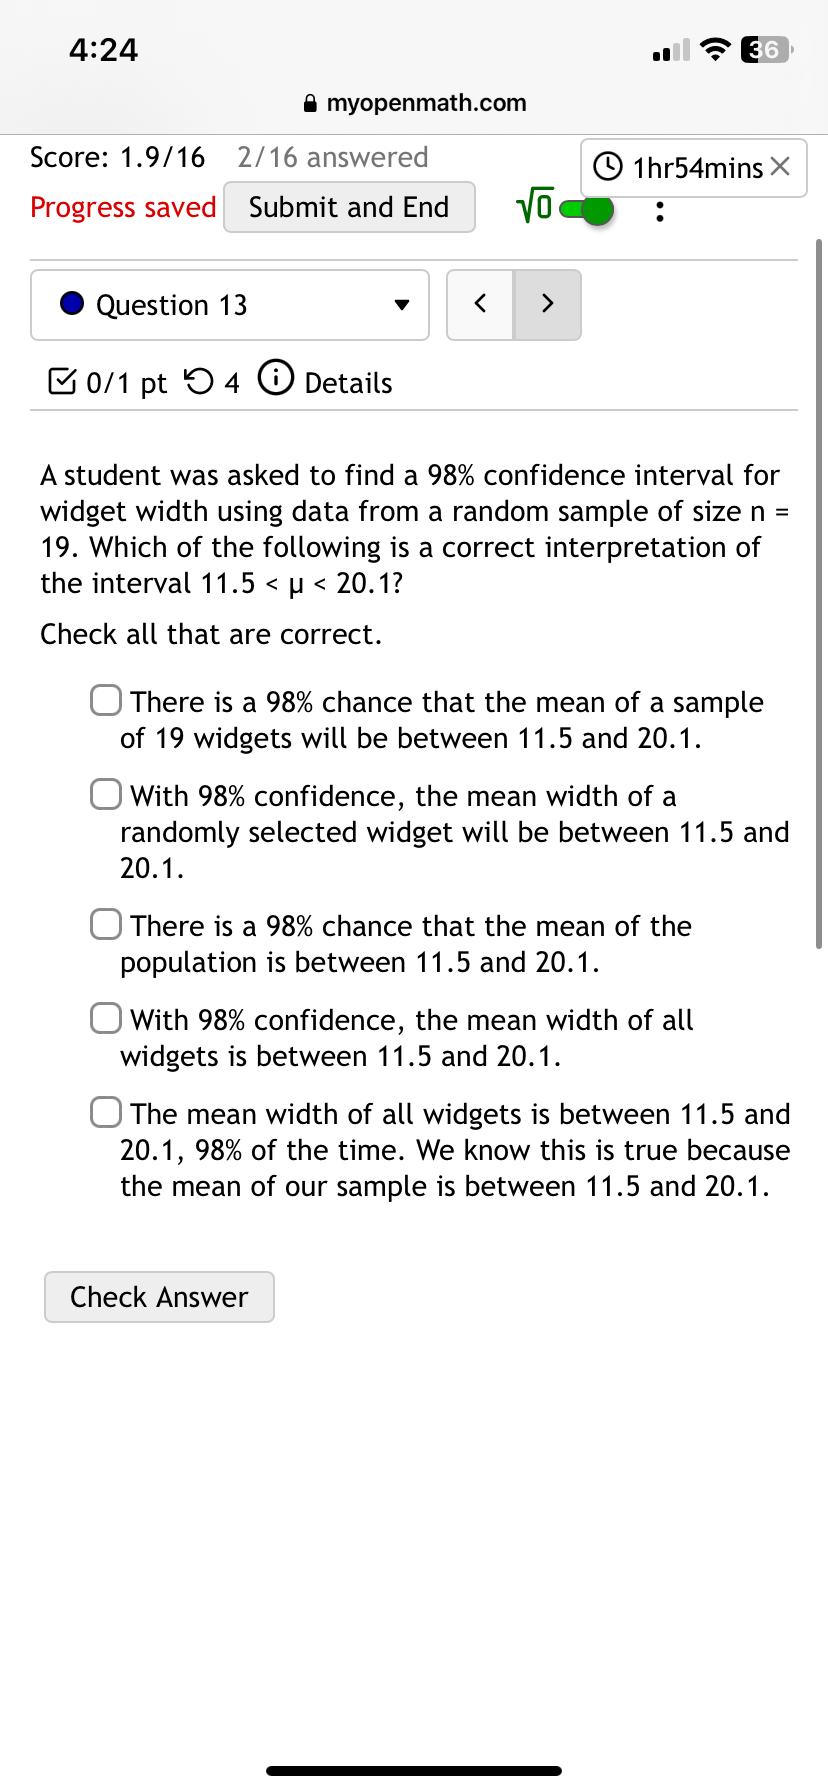
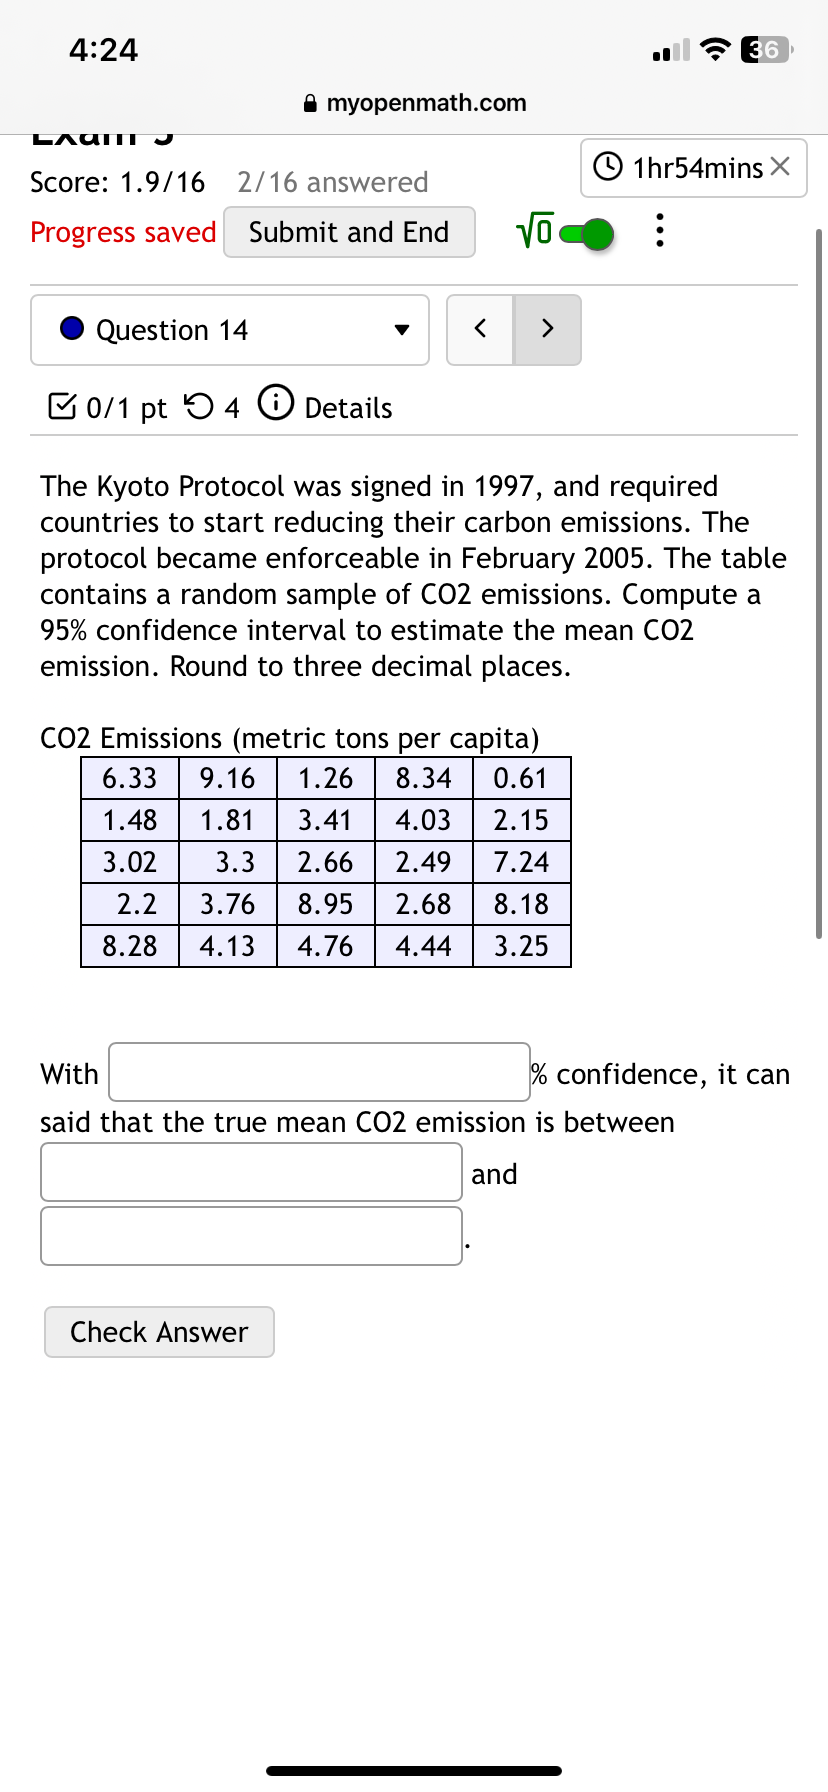
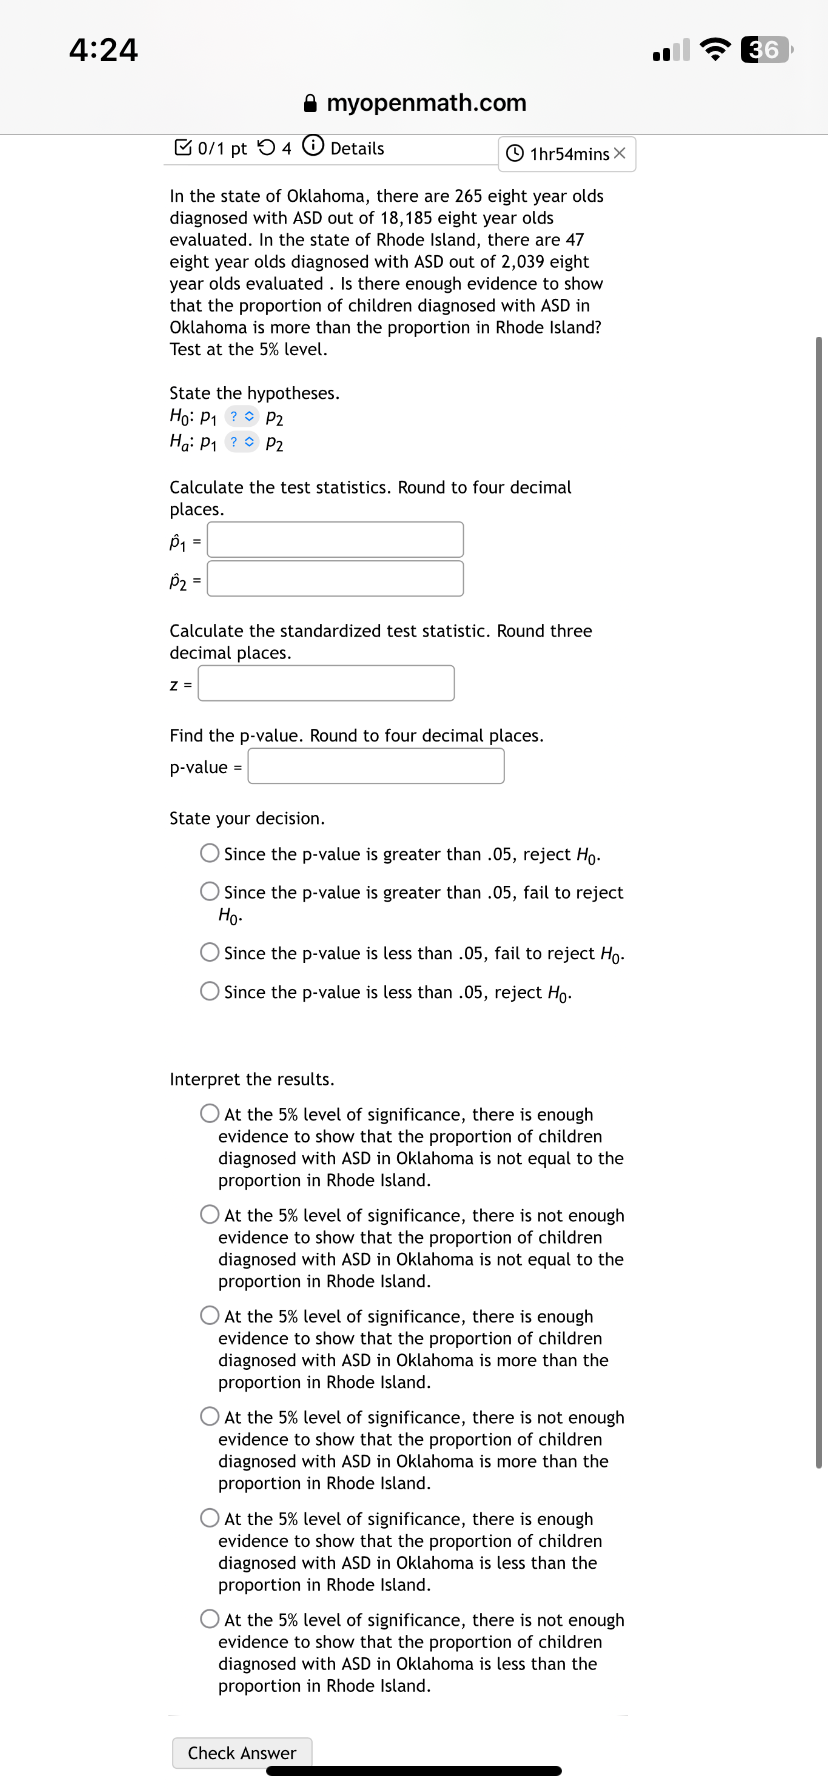
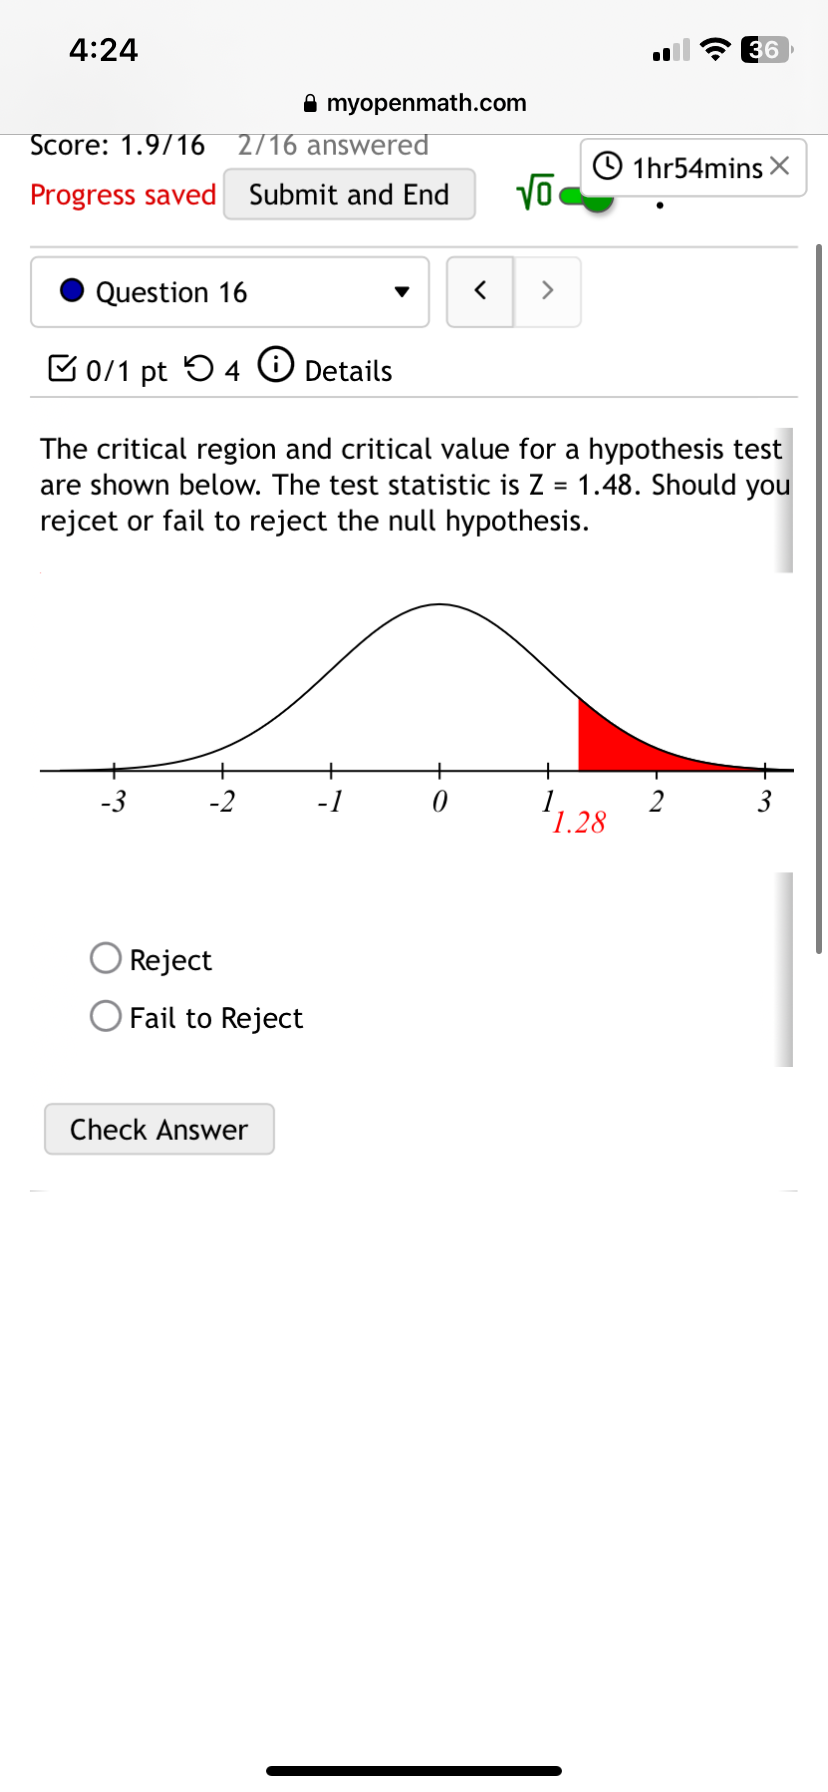
& 0/1pt O 4 @ petails Using two different confidence levels, a researcher constructs two confidence intervals for a population mean based on one sample taken from a normal population with known population variance o' = 625. The standard error of the mean is 3.536. The confidence intervals are: Interval 1: 87.37 & 0/1pt 4 O Details A college admissions officer takes a simple random sample of 81 entering freshman and computes their average mathematics SAT score. They find an average of 530 with a standard deviation of 45. We are interested in the average math SAT score. a) What parameter are we estimating? Select an answer & 0/1pt O 4 O Details A student was asked to find a 98% confidence interval for widget width using data from a random sample of size n = 19. Which of the following is a correct interpretation of the interval 11.5 0/1 pt 1 4 0 Details The Kyoto Protocol was signed in 1997, and required countries to start reducing their carbon emissions. The protocol became enforceable in February 2005. The table contains a random sample of CO2 emissions. Compute a 95% confidence interval to estimate the mean CO2 emission. Round to three decimal places. CO2 Emissions (metric tons per capita) 6.33 9.16 1.26 8.34 0.61 1.48 1.81 3.41 4.03 2. 15 3.02 3.3 2.66 2.49 7.24 2.2 3.76 8.95 2.68 8. 18 8.28 4.13 4.76 4.44 3.25 With % confidence, it can said that the true mean CO2 emission is between and Check Answer4 24 & myopenmath.com & 0/1pt O 4 O Details @ 1hrS4mins X In the state of Oklahoma, there are 265 eight year olds diagnosed with ASD out of 18,185 eight year olds evaluated. In the state of Rhode Island, there are 47 eight year olds diagnosed with ASD out of 2,039 eight year olds evaluated . Is there enough evidence to show that the proportion of children diagnosed with ASD in Oklahoma is more than the proportion in Rhode Island? Test at the 5% level. State the hypotheses. Ho:py 2 p2 Haip1 22 pg o0 Calculate the test statistics. Round to four decimal places. s | P1=] z'l Calculate the standardized test statistic. Round three decimal places. Z= Find the p-value. Round to four decimal places. p-value = State your decision. (O Since the p-value is greater than .05, reject H. (D Since the p-value is greater than .05, fail to reject H. (O Since the p-value is less than .05, fail to reject Hp.- (O Since the p-value is less than .05, reject H. Interpret the results. () At the 5% level of significance, there is enough evidence to show that the proportion of children diagnosed with ASD in Oklahoma is not equal to the proportion in Rhode Island. () At the 5% level of significance, there is not enough evidence to show that the proportion of children diagnosed with ASD in Oklahoma is not equal to the proportion in Rhode Island. () At the 5% level of significance, there is enough evidence to show that the proportion of children diagnosed with ASD in Oklahoma is more than the proportion in Rhode Island. () At the 5% level of significance, there is not enough evidence to show that the proportion of children diagnosed with ASD in Oklahoma is more than the proportion in Rhode Island. (O At the 5% level of significance, there is enough evidence to show that the proportion of children diagnosed with ASD in Oklahoma is less than the proportion in Rhode Island. (O At the 5% level of significance, there is not enough evidence to show that the proportion of children diagnosed with ASD in Oklahoma is less than the proportion in Rhode Island. Check Answer s 9) 4:24 sl ":\" E & myopenmath.com Score: 1.9/16 2/16 answered 1hr54mins % Progress saved Submit and End V.. - @ Question 16 v & 0/1pt O 4 O Details The critical region and critical value for a hypothesis test are shown below. The test statistic is Z = 1.48. Should you rejcet or fail to reject the null hypothesis. O Reject O Fail to Reject Check
Step by Step Solution
There are 3 Steps involved in it

Get step-by-step solutions from verified subject matter experts