

Question: 420. 4.2. Applying the method to estimate WACC for a publicly traded firm, estimate WACC for ALICO for 2019 (i.e., use both book and market
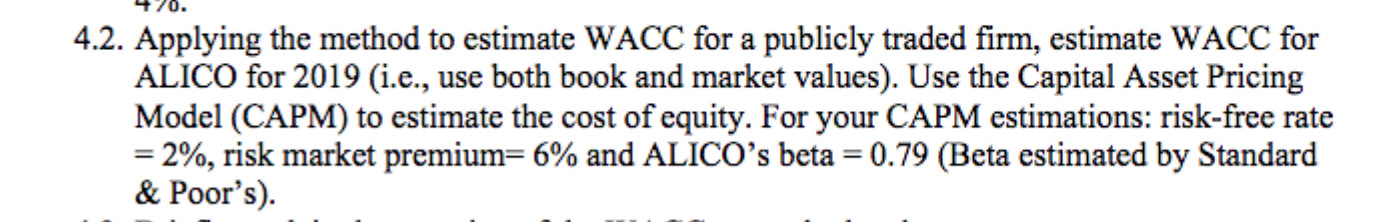
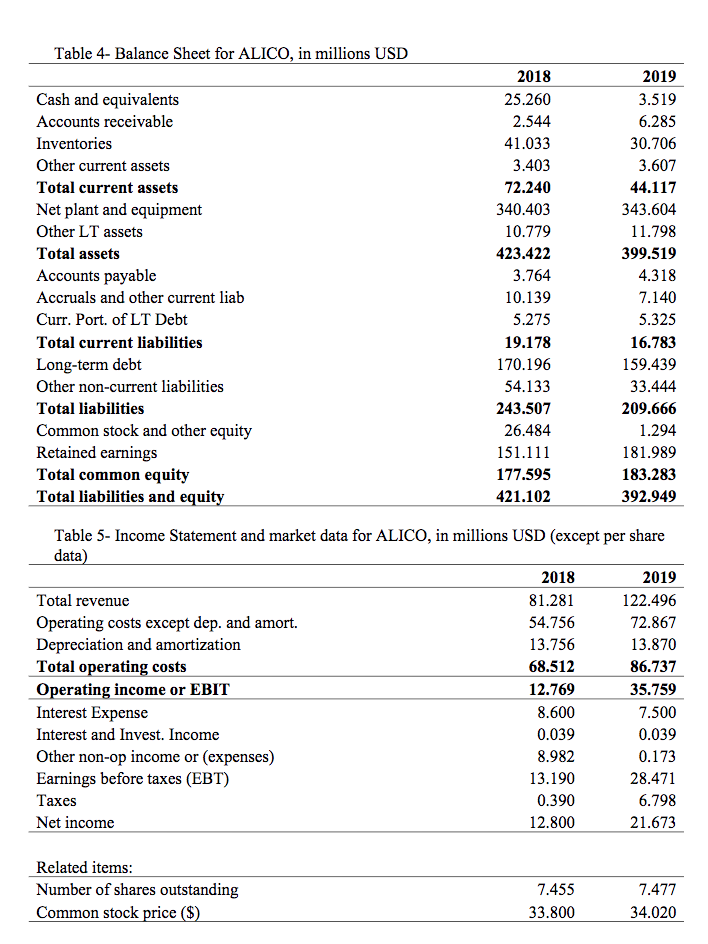
420. 4.2. Applying the method to estimate WACC for a publicly traded firm, estimate WACC for ALICO for 2019 (i.e., use both book and market values). Use the Capital Asset Pricing Model (CAPM) to estimate the cost of equity. For your CAPM estimations: risk-free rate = 2%, risk market premium= 6% and ALICO's beta = 0.79 (Beta estimated by Standard & Poor's). Table 4- Balance Sheet for ALICO, in millions USD Cash and equivalents Accounts receivable Inventories Other current assets Total current assets Net plant and equipment Other LT assets Total assets Accounts payable Accruals and other current liab Curr. Port. of LT Debt Total current liabilities Long-term debt Other non-current liabilities Total liabilities Common stock and other equity Retained earnings Total common equity Total liabilities and equity 2018 25.260 2.544 41.033 3.403 72.240 340.403 10.779 423.422 3.764 10.139 5.275 19.178 170.196 54.133 243.507 26.484 151.111 177.595 421.102 2019 3.519 6.285 30.706 3.607 44.117 343.604 11.798 399.519 4.318 7.140 5.325 16.783 159.439 33.444 209.666 1.294 181.989 183.283 392.949 2018 Table 5- Income Statement and market data for ALICO, in millions USD (except per share data) 2019 Total revenue 81.281 122.496 Operating costs except dep. and amort. 54.756 72.867 Depreciation and amortization 13.756 13.870 Total operating costs 68.512 86.737 Operating income or EBIT 12.769 35.759 Interest Expense 8.600 7.500 Interest and Invest. Income 0.039 0.039 Other non-op income or expenses) 8.982 0.173 Earnings before taxes (EBT) 13.190 28.471 Taxes 0.390 6.798 Net income 12.800 21.673 Related items: Number of shares outstanding Common stock price ($) 7.455 7.477 34.020 33.800 420. 4.2. Applying the method to estimate WACC for a publicly traded firm, estimate WACC for ALICO for 2019 (i.e., use both book and market values). Use the Capital Asset Pricing Model (CAPM) to estimate the cost of equity. For your CAPM estimations: risk-free rate = 2%, risk market premium= 6% and ALICO's beta = 0.79 (Beta estimated by Standard & Poor's). Table 4- Balance Sheet for ALICO, in millions USD Cash and equivalents Accounts receivable Inventories Other current assets Total current assets Net plant and equipment Other LT assets Total assets Accounts payable Accruals and other current liab Curr. Port. of LT Debt Total current liabilities Long-term debt Other non-current liabilities Total liabilities Common stock and other equity Retained earnings Total common equity Total liabilities and equity 2018 25.260 2.544 41.033 3.403 72.240 340.403 10.779 423.422 3.764 10.139 5.275 19.178 170.196 54.133 243.507 26.484 151.111 177.595 421.102 2019 3.519 6.285 30.706 3.607 44.117 343.604 11.798 399.519 4.318 7.140 5.325 16.783 159.439 33.444 209.666 1.294 181.989 183.283 392.949 2018 Table 5- Income Statement and market data for ALICO, in millions USD (except per share data) 2019 Total revenue 81.281 122.496 Operating costs except dep. and amort. 54.756 72.867 Depreciation and amortization 13.756 13.870 Total operating costs 68.512 86.737 Operating income or EBIT 12.769 35.759 Interest Expense 8.600 7.500 Interest and Invest. Income 0.039 0.039 Other non-op income or expenses) 8.982 0.173 Earnings before taxes (EBT) 13.190 28.471 Taxes 0.390 6.798 Net income 12.800 21.673 Related items: Number of shares outstanding Common stock price ($) 7.455 7.477 34.020 33.800
Step by Step Solution
There are 3 Steps involved in it

Get step-by-step solutions from verified subject matter experts