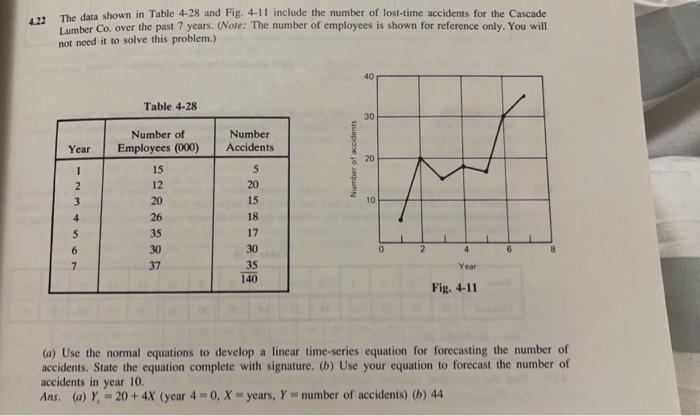
Question: 4.22 The data shown in Table 4-28 and Fig. 4-11 include the number of lost-time accidents for the Cascade Lumber Co. over the past 7

4.22 The data shown in Table 4-28 and Fig. 4-11
4.22 The data shown in Table 4-28 and Fig. 4-11 include the number of lost-time accidents for the Cascade Lumber Co. over the past 7 years. (Note: The number of employees is shown for reference only. You will not need it to solve this problem.) 40 Table 4-28 30 Number Accidents Year Number of accidents 20 1 2 3 4 Number of Employees (000) 15 12 20 26 35 30 37 10 5 20 15 18 17 30 35 140 5 6 7 0 4 6 Year Fig. 4-11 (a) Use the normal equations to develop a linear time-series equation for forecasting the number of accidents. State the equation complete with signature. (b) Use your equation to forecast the number of accidents in year 10. Ans.(a) Y, -20 + 4X (year 40, Xyears, Y = number of accidents) (h) 44 4.22 The data shown in Table 4-28 and Fig. 4-11 include the number of lost-time accidents for the Cascade Lumber Co. over the past 7 years. (Note: The number of employees is shown for reference only. You will not need it to solve this problem.) 40 Table 4-28 30 Number Accidents Year Number of accidents 20 1 2 3 4 Number of Employees (000) 15 12 20 26 35 30 37 10 5 20 15 18 17 30 35 140 5 6 7 0 4 6 Year Fig. 4-11 (a) Use the normal equations to develop a linear time-series equation for forecasting the number of accidents. State the equation complete with signature. (b) Use your equation to forecast the number of accidents in year 10. Ans.(a) Y, -20 + 4X (year 40, Xyears, Y = number of accidents) (h) 44

Step by Step Solution

There are 3 Steps involved in it

1 Expert Approved Answer
Step: 1 Unlock blur-text-image
Question Has Been Solved by an Expert!

Get step-by-step solutions from verified subject matter experts

Step: 2 Unlock
Step: 3 Unlock

Students Have Also Explored These Related General Management Questions!