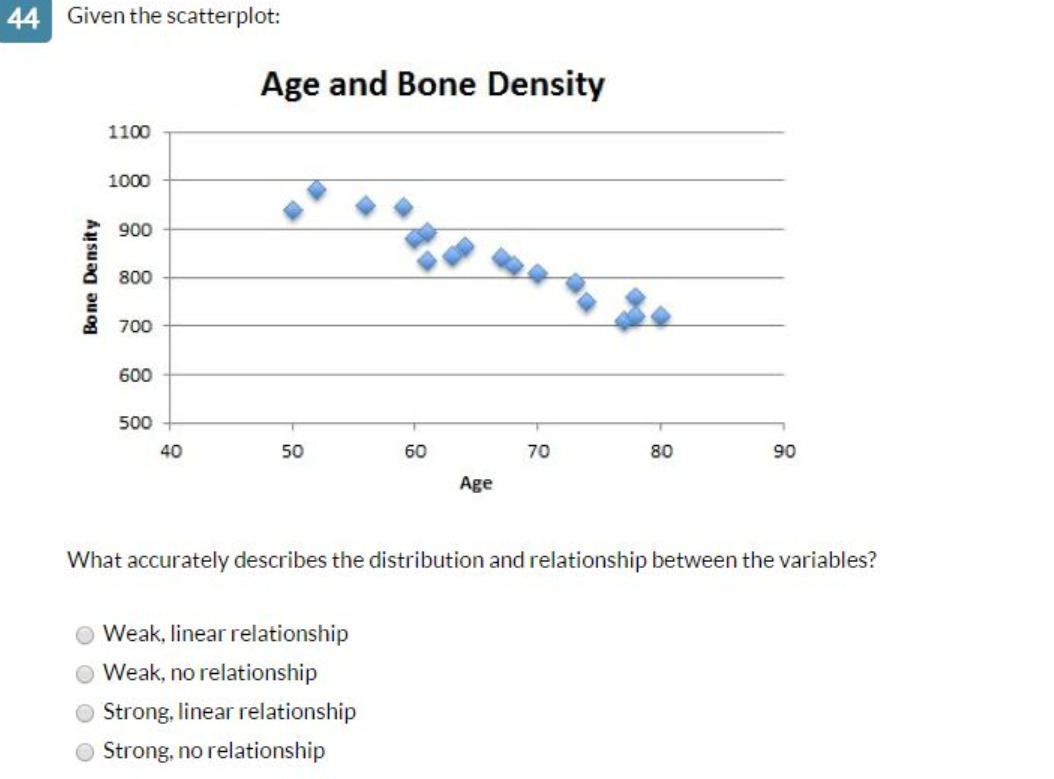
Question: 44 Given the scatterplot: Age and Bone Density 1100 1000 900 Bone Density 800 700 600 500 40 50 60 70 80 90 Age What

44 Given the scatterplot: Age and Bone Density
44 Given the scatterplot: Age and Bone Density 1100 1000 900 Bone Density 800 700 600 500 40 50 60 70 80 90 Age What accurately describes the distribution and relationship between the variables? O Weak, linear relationship Weak, no relationship Strong, linear relationship Strong, no relationship

Step by Step Solution

There are 3 Steps involved in it

1 Expert Approved Answer
Step: 1 Unlock blur-text-image
Question Has Been Solved by an Expert!

Get step-by-step solutions from verified subject matter experts

Step: 2 Unlock
Step: 3 Unlock

Students Have Also Explored These Related Mathematics Questions!