

Question: 4.4 Measures of Position: Quartiles and DO You are given the following data for average gas mileage (miles per gallon) for automobiles built in 201
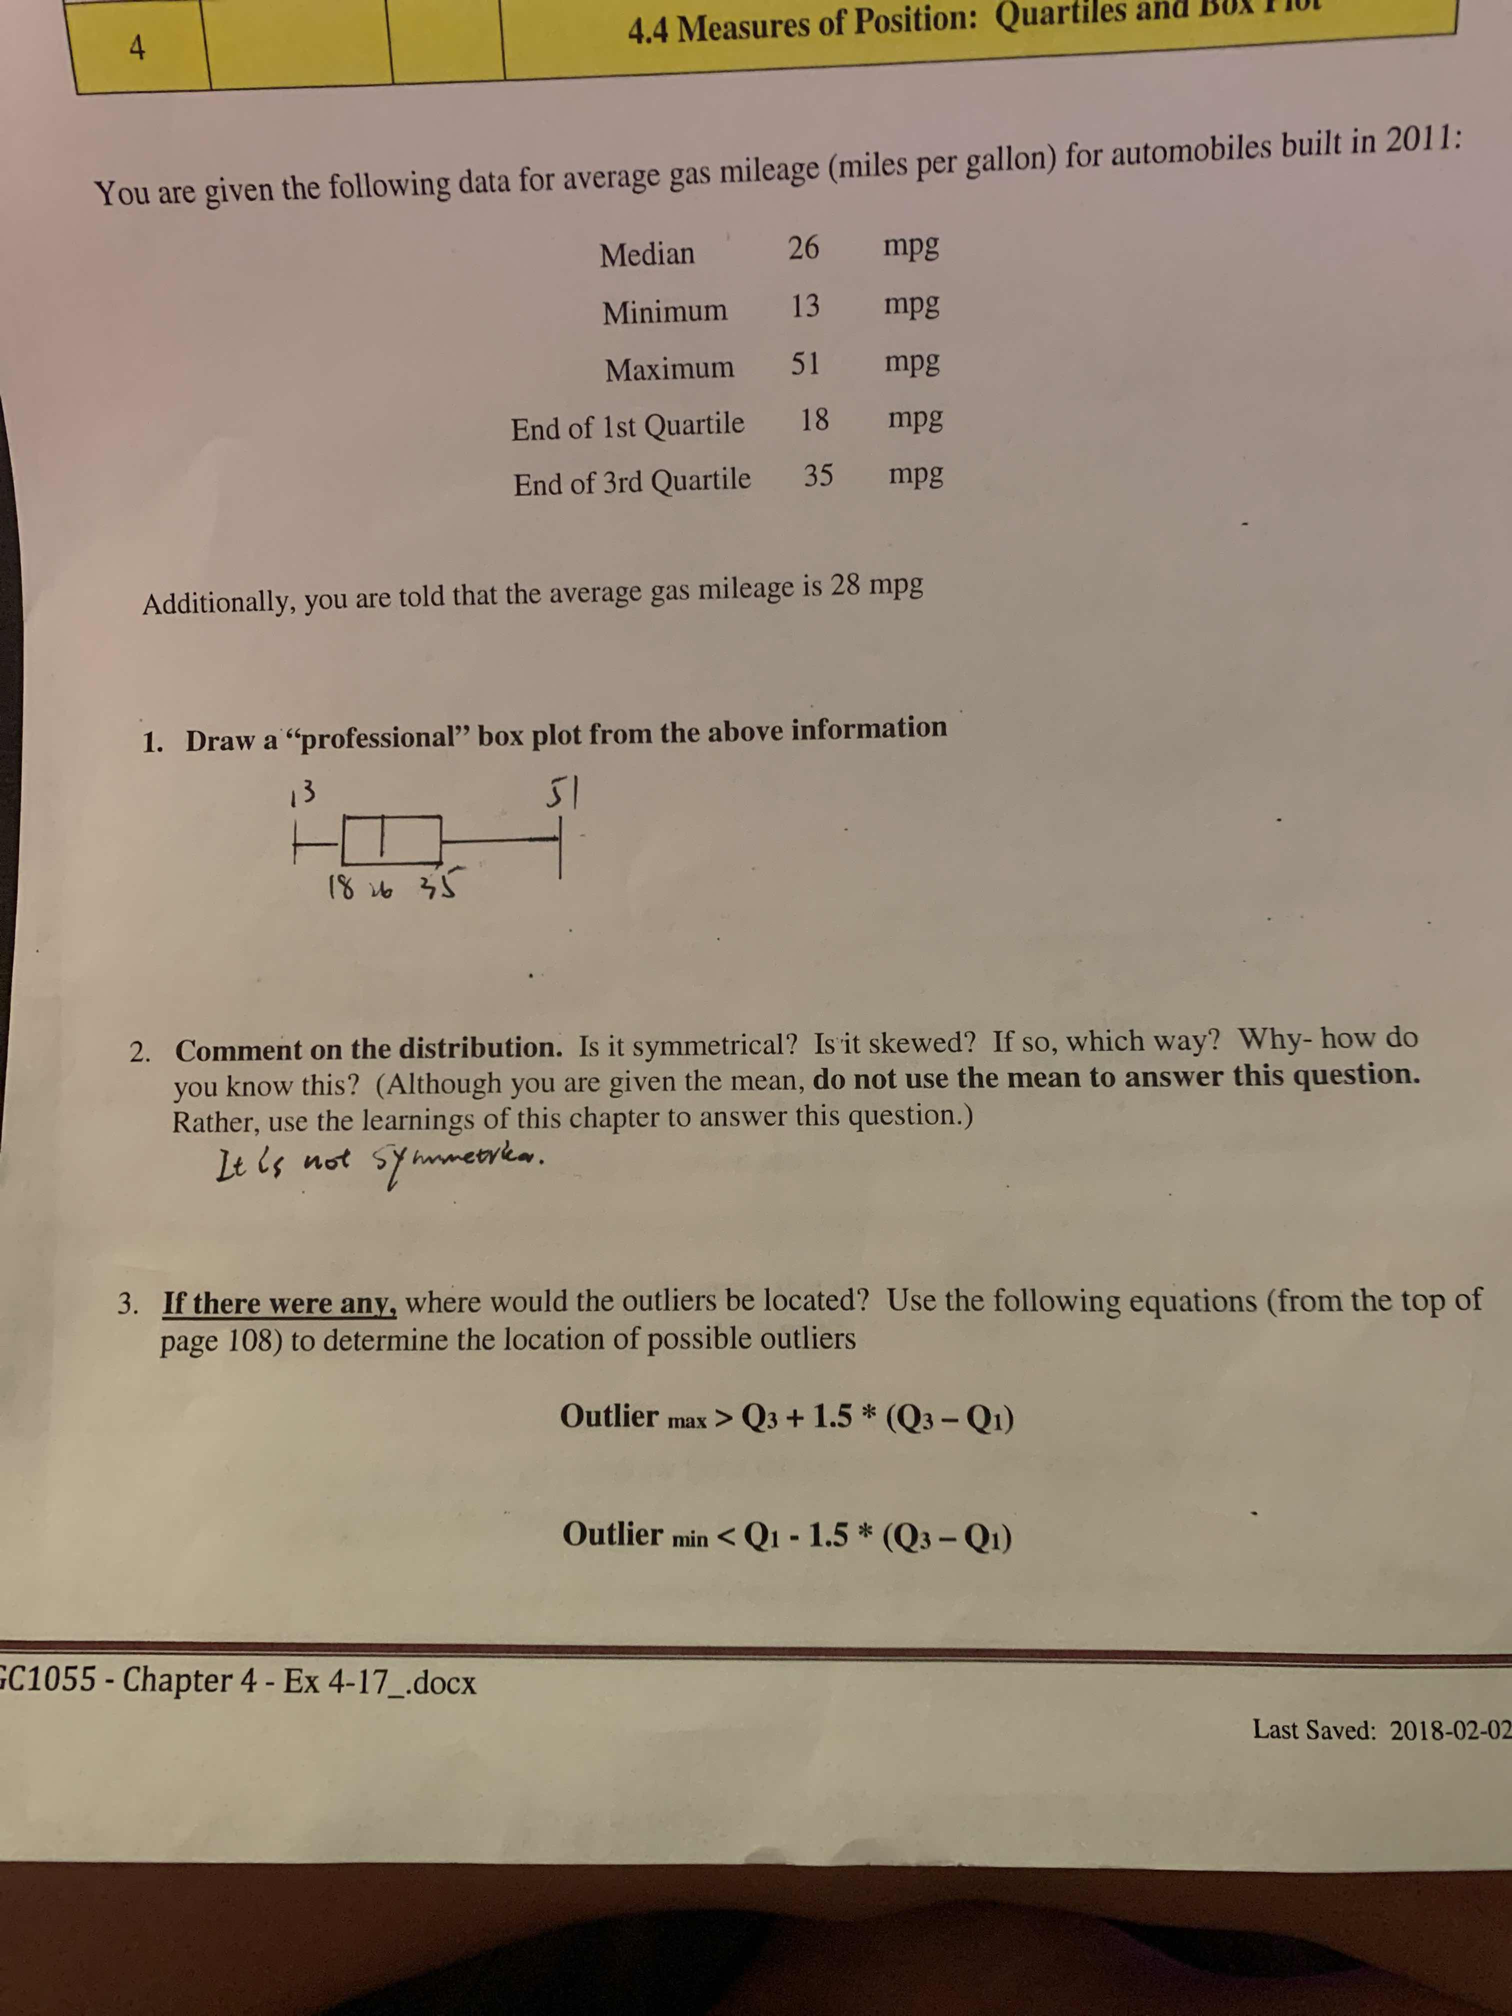
4.4 Measures of Position: Quartiles and DO You are given the following data for average gas mileage (miles per gallon) for automobiles built in 201 1: Median 26 mpg Minimum 13 mpg Maximum 51 mpg End of 1st Quartile 18 mpg End of 3rd Quartile 35 mpg Additionally, you are told that the average gas mileage is 28 mpg 1. Draw a "professional" box plot from the above information 13 18 26 35 2. Comment on the distribution. Is it symmetrical? Is it skewed? If so, which way? Why- how do you know this? (Although you are given the mean, do not use the mean to answer this question. Rather, use the learnings of this chapter to answer this question.) It is not symmetrica. 3. If there were any, where would the outliers be located? Use the following equations (from the top of page 108) to determine the location of possible outliers Outlier max > Q3 + 1.5 * (Q3 - Q1) Outlier min
Step by Step Solution
There are 3 Steps involved in it

Get step-by-step solutions from verified subject matter experts