

Question: .. 4.45 Caf Michigan's manager, Gary Stark, suspects that demand for mocha latte coffees depends on the price being charged. Based on historical observations, Gary
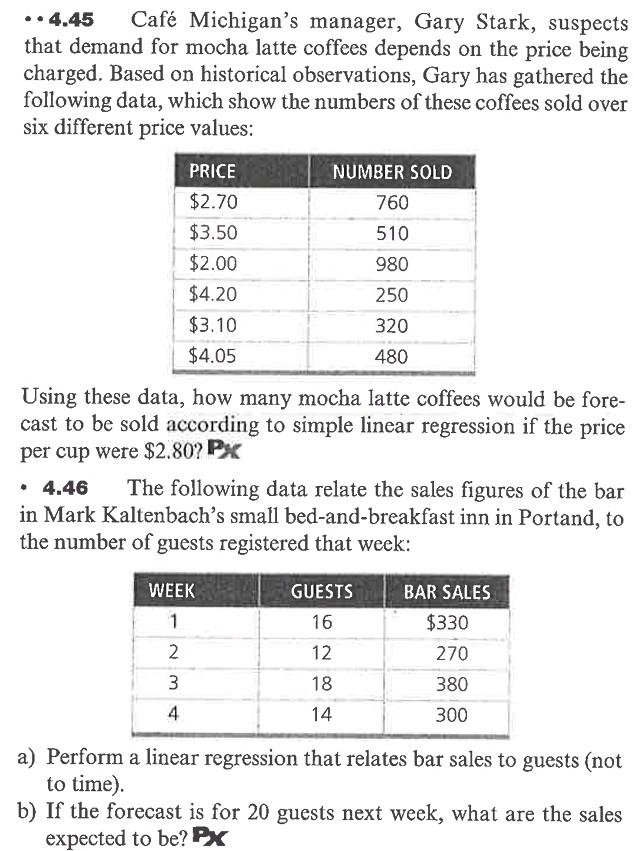
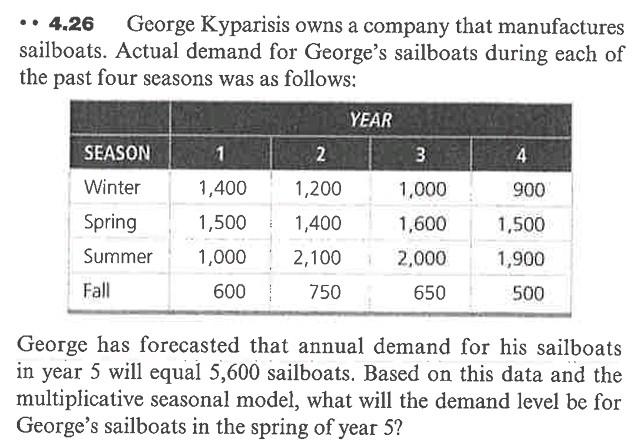
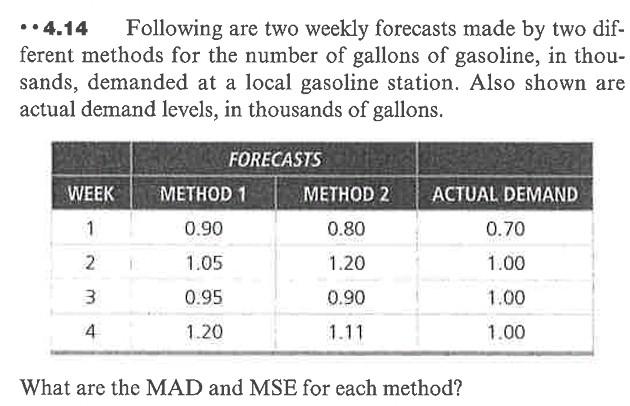
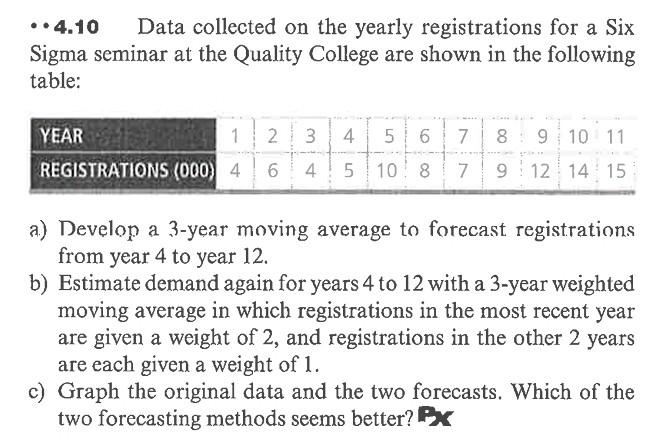
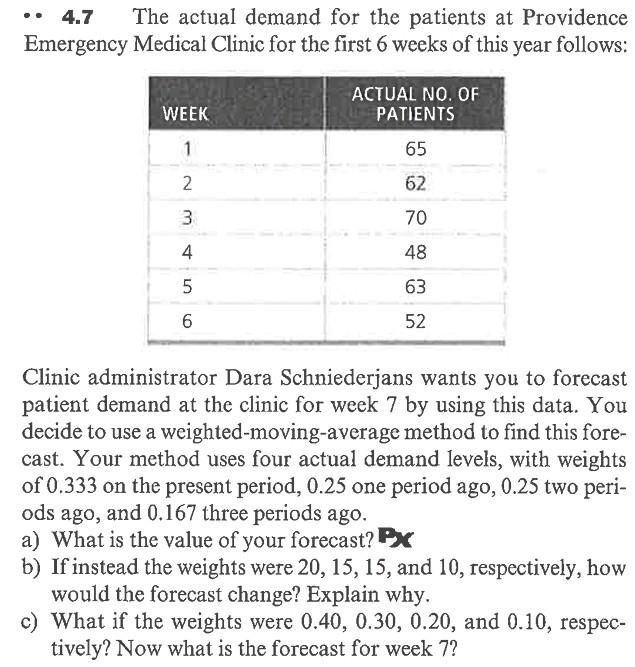
.. 4.45 Caf Michigan's manager, Gary Stark, suspects that demand for mocha latte coffees depends on the price being charged. Based on historical observations, Gary has gathered the following data, which show the numbers of these coffees sold over six different price values: PRICE NUMBER SOLD $2.70 760 $3.50 510 $2.00 980 $4.20 250 $3.10 320 $4.05 480 Using these data, how many mocha latte coffees would be fore- cast to be sold according to simple linear regression if the price per cup were $2.807 PX 4.46 The following data relate the sales figures of the bar in Mark Kaltenbach's small bed-and-breakfast inn in Portand, to the number of guests registered that week: WEEK 1 GUESTS 16 BAR SALES $330 270 2 12 Nm 18 380 3 4 14 300 a) Perform a linear regression that relates bar sales to guests (not to time). b) If the forecast is for 20 guests next week, what are the sales expected to be? PX . . 4.26 George Kyparisis owns a company that manufactures sailboats. Actual demand for George's sailboats during each of the past four seasons was as follows: YEAR SEASON 1 2 3 3 4 Winter 900 Spring Summer Fall 1,400 1,500 1,000 600 1,200 1,400 2,100 1,500 1,000 1,600 2,000 1,900 750 650 500 George has forecasted that annual demand for his sailboats in year 5 will equal 5,600 sailboats. Based on this data and the multiplicative seasonal model, what will the demand level be for George's sailboats in the spring of year 5? ..4.14 Following are two weekly forecasts made by two dif- ferent methods for the number of gallons of gasoline, in thou- sands, demanded at a local gasoline station. Also shown are actual demand levels, in thousands of gallons. WEEK FORECASTS METHOD 1 METHOD 2 0.90 0.80 ACTUAL DEMAND 0.70 1 2 N 2 1.05 1.20 1.00 3 0.90 1.00 0.95 1.20 4 1.11 1.00 What are the MAD and MSE for each method? . .4.10 Data collected on the yearly registrations for a Six Sigma seminar at the Quality College are shown in the following table: 6 YEAR 123 REGISTRATIONS (000) 4 6 4 4 5 6 7 8 9 10 11 5 10 8 7 9 12 14 15 4 a) Develop a 3-year moving average to forecast registrations from year 4 to year 12. b) Estimate demand again for years 4 to 12 with a 3-year weighted moving average in which registrations in the most recent year are given a weight of 2, and registrations in the other 2 years are each given a weight of 1. c) Graph the original data and the two forecasts. Which of the two forecasting methods seems better? PX 4.7 The actual demand for the patients at Providence Emergency Medical Clinic for the first 6 weeks of this year follows: ACTUAL NO. OF PATIENTS WEEK 1 65 2 62 w 3 70 48 4 5 5 63 6 52 Clinic administrator Dara Schniederjans wants you to forecast patient demand at the clinic for week 7 by using this data. You decide to use a weighted-moving-average method to find this fore- cast. Your method uses four actual demand levels, with weights of 0.333 on the present period, 0.25 one period ago, 0.25 two peri- ods ago, and 0.167 three periods ago. a) What is the value of your forecast? PX b) If instead the weights were 20, 15, 15, and 10, respectively, how would the forecast change? Explain why, c) What if the weights were 0.40, 0.30, 0.20, and 0.10, respec- tively? Now what is the forecast for week 7
Step by Step Solution
There are 3 Steps involved in it
1 Expert Approved Answer
Step: 1 Unlock

Question Has Been Solved by an Expert!
Get step-by-step solutions from verified subject matter experts
Step: 2 Unlock
Step: 3 Unlock