

Question: 4:58 PM Thu Apr 14 . . . Take Quiz 8. The graph below shows capital per worker and the steady state, along with other
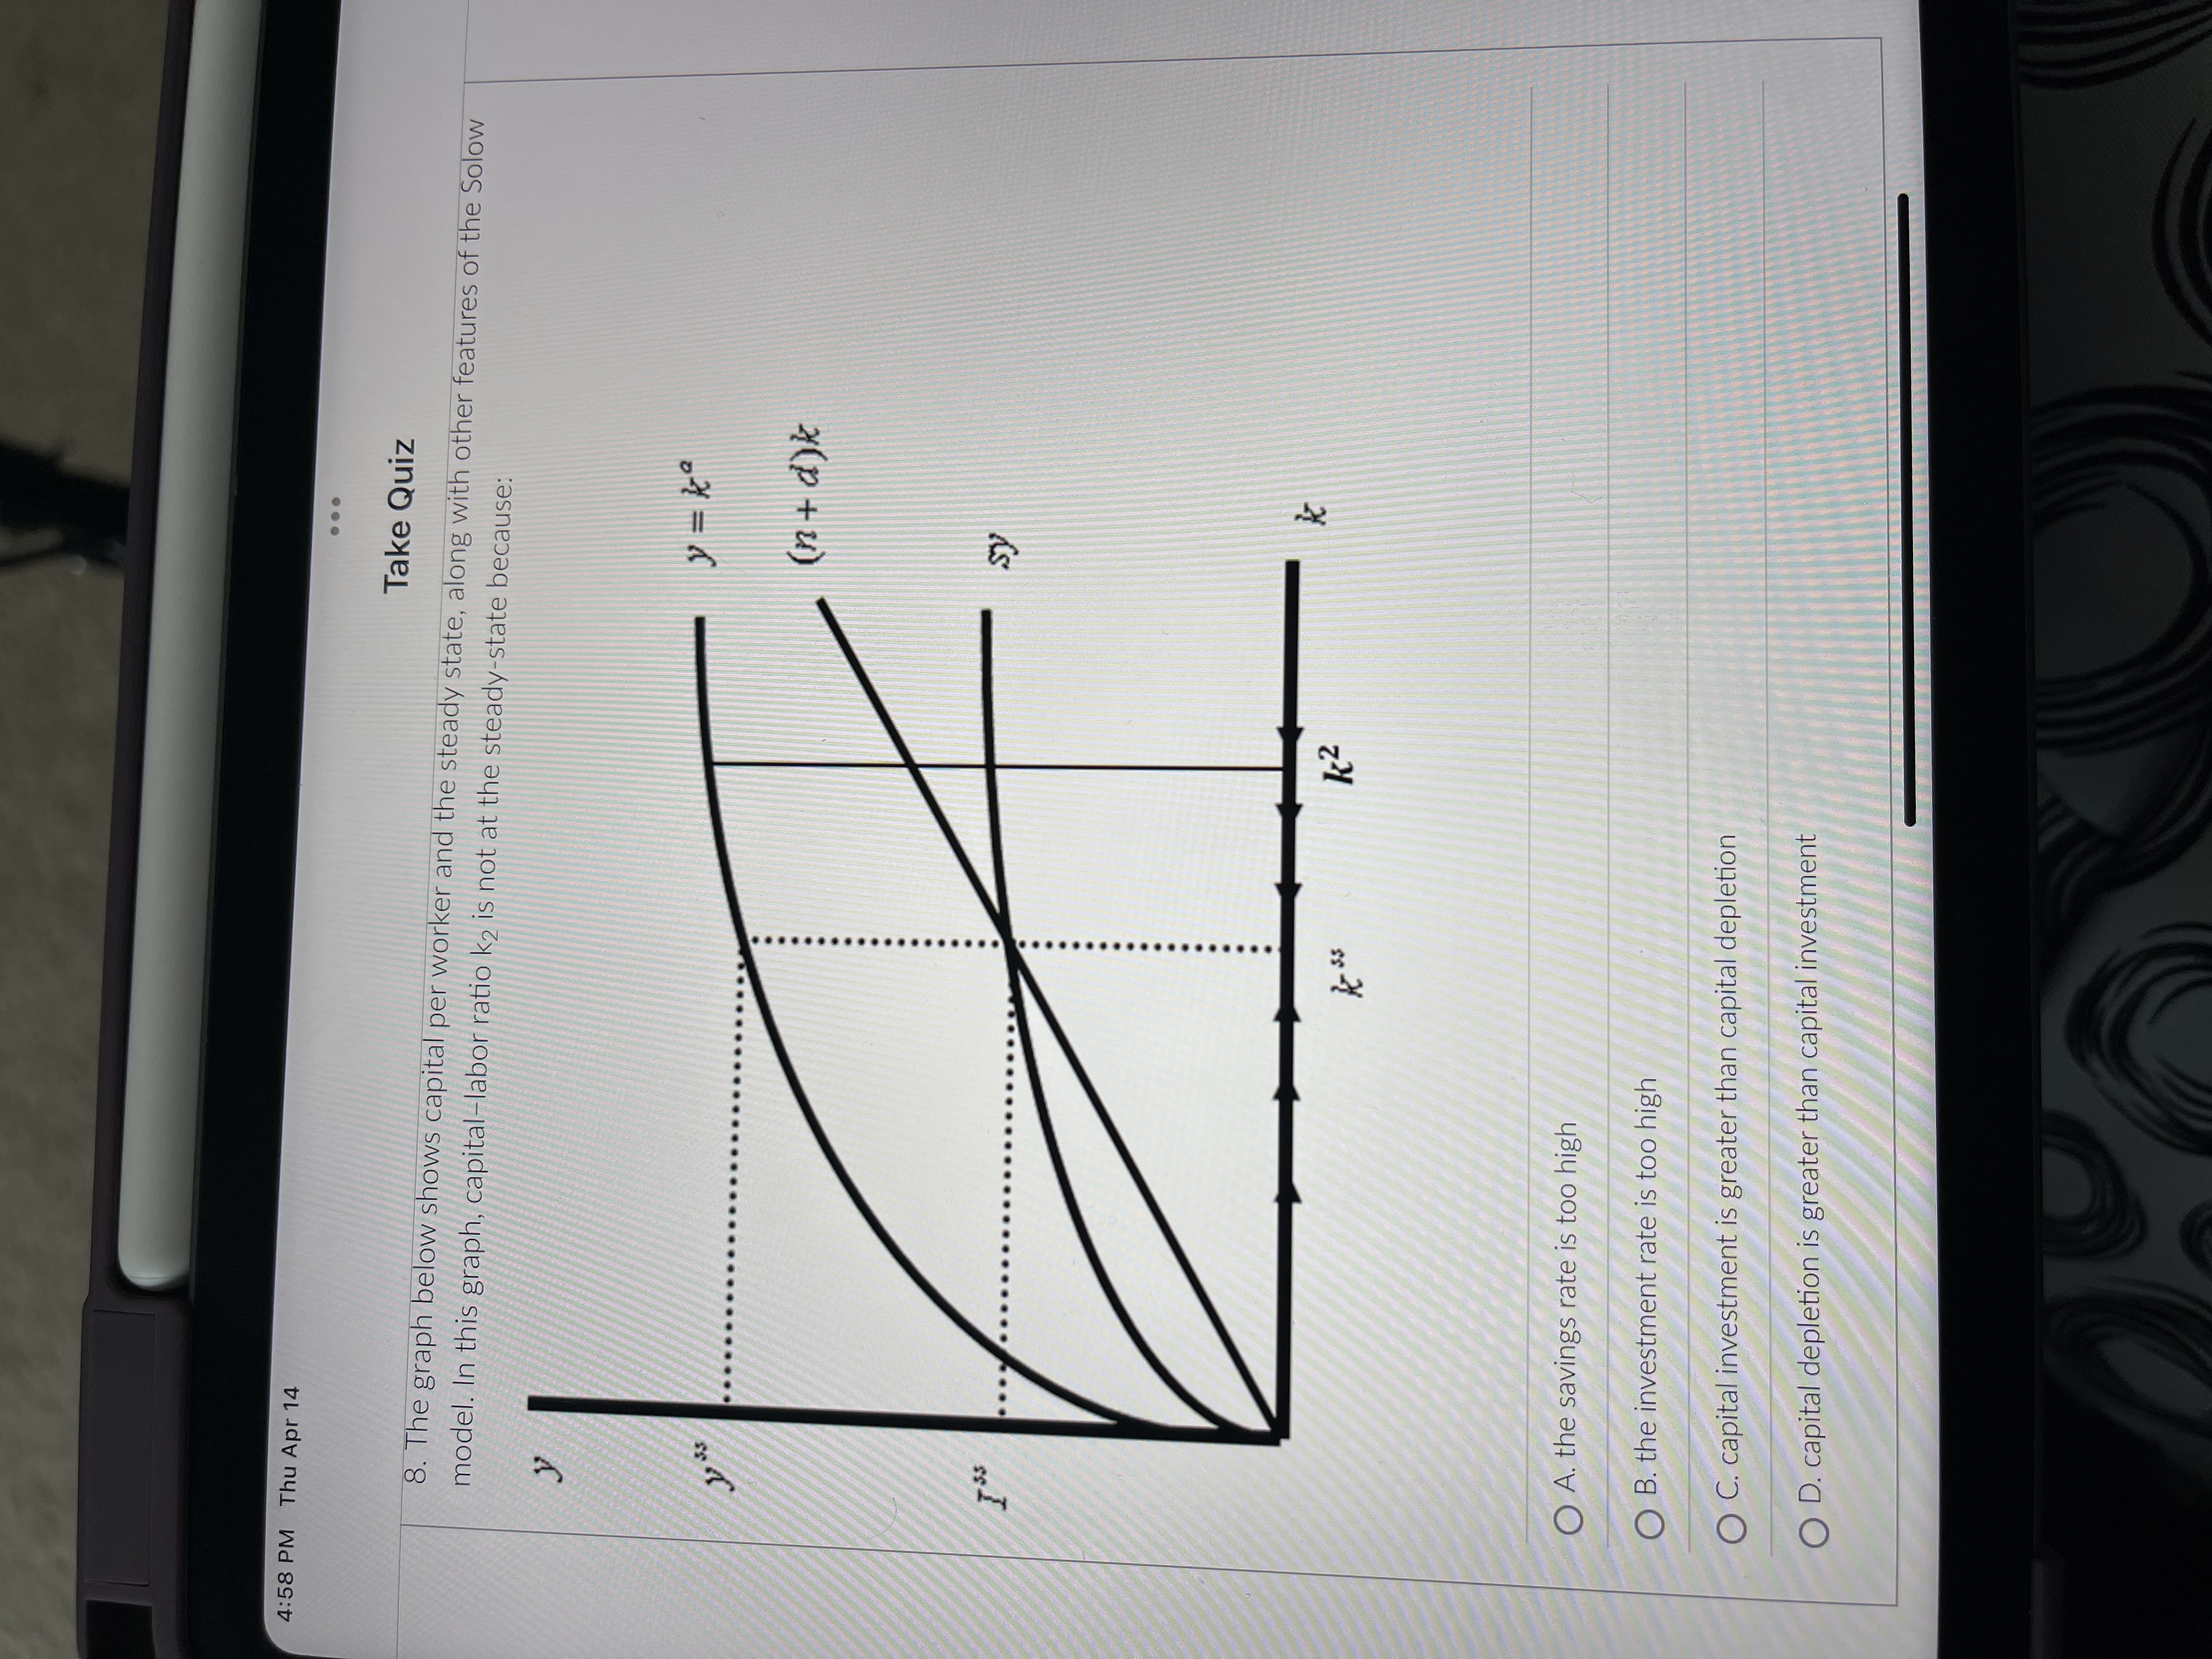
4:58 PM Thu Apr 14 . . . Take Quiz 8. The graph below shows capital per worker and the steady state, along with other features of the Solow model. In this graph, capital-labor ratio k2 is not at the steady-state because: y = k (n + d)k . ............. sy . . . . . ........ k k2 O A. the savings rate is too high B. the investment rate is too high O C. capital investment is greater than capital depletion O D. capital depletion is greater than capital investment
Step by Step Solution
There are 3 Steps involved in it
1 Expert Approved Answer
Step: 1 Unlock

Question Has Been Solved by an Expert!
Get step-by-step solutions from verified subject matter experts
Step: 2 Unlock
Step: 3 Unlock