

Question: + + 46 53 60 67 74 81 88 Test Scores Q Use the graph of the normal curve to complete the statement: This
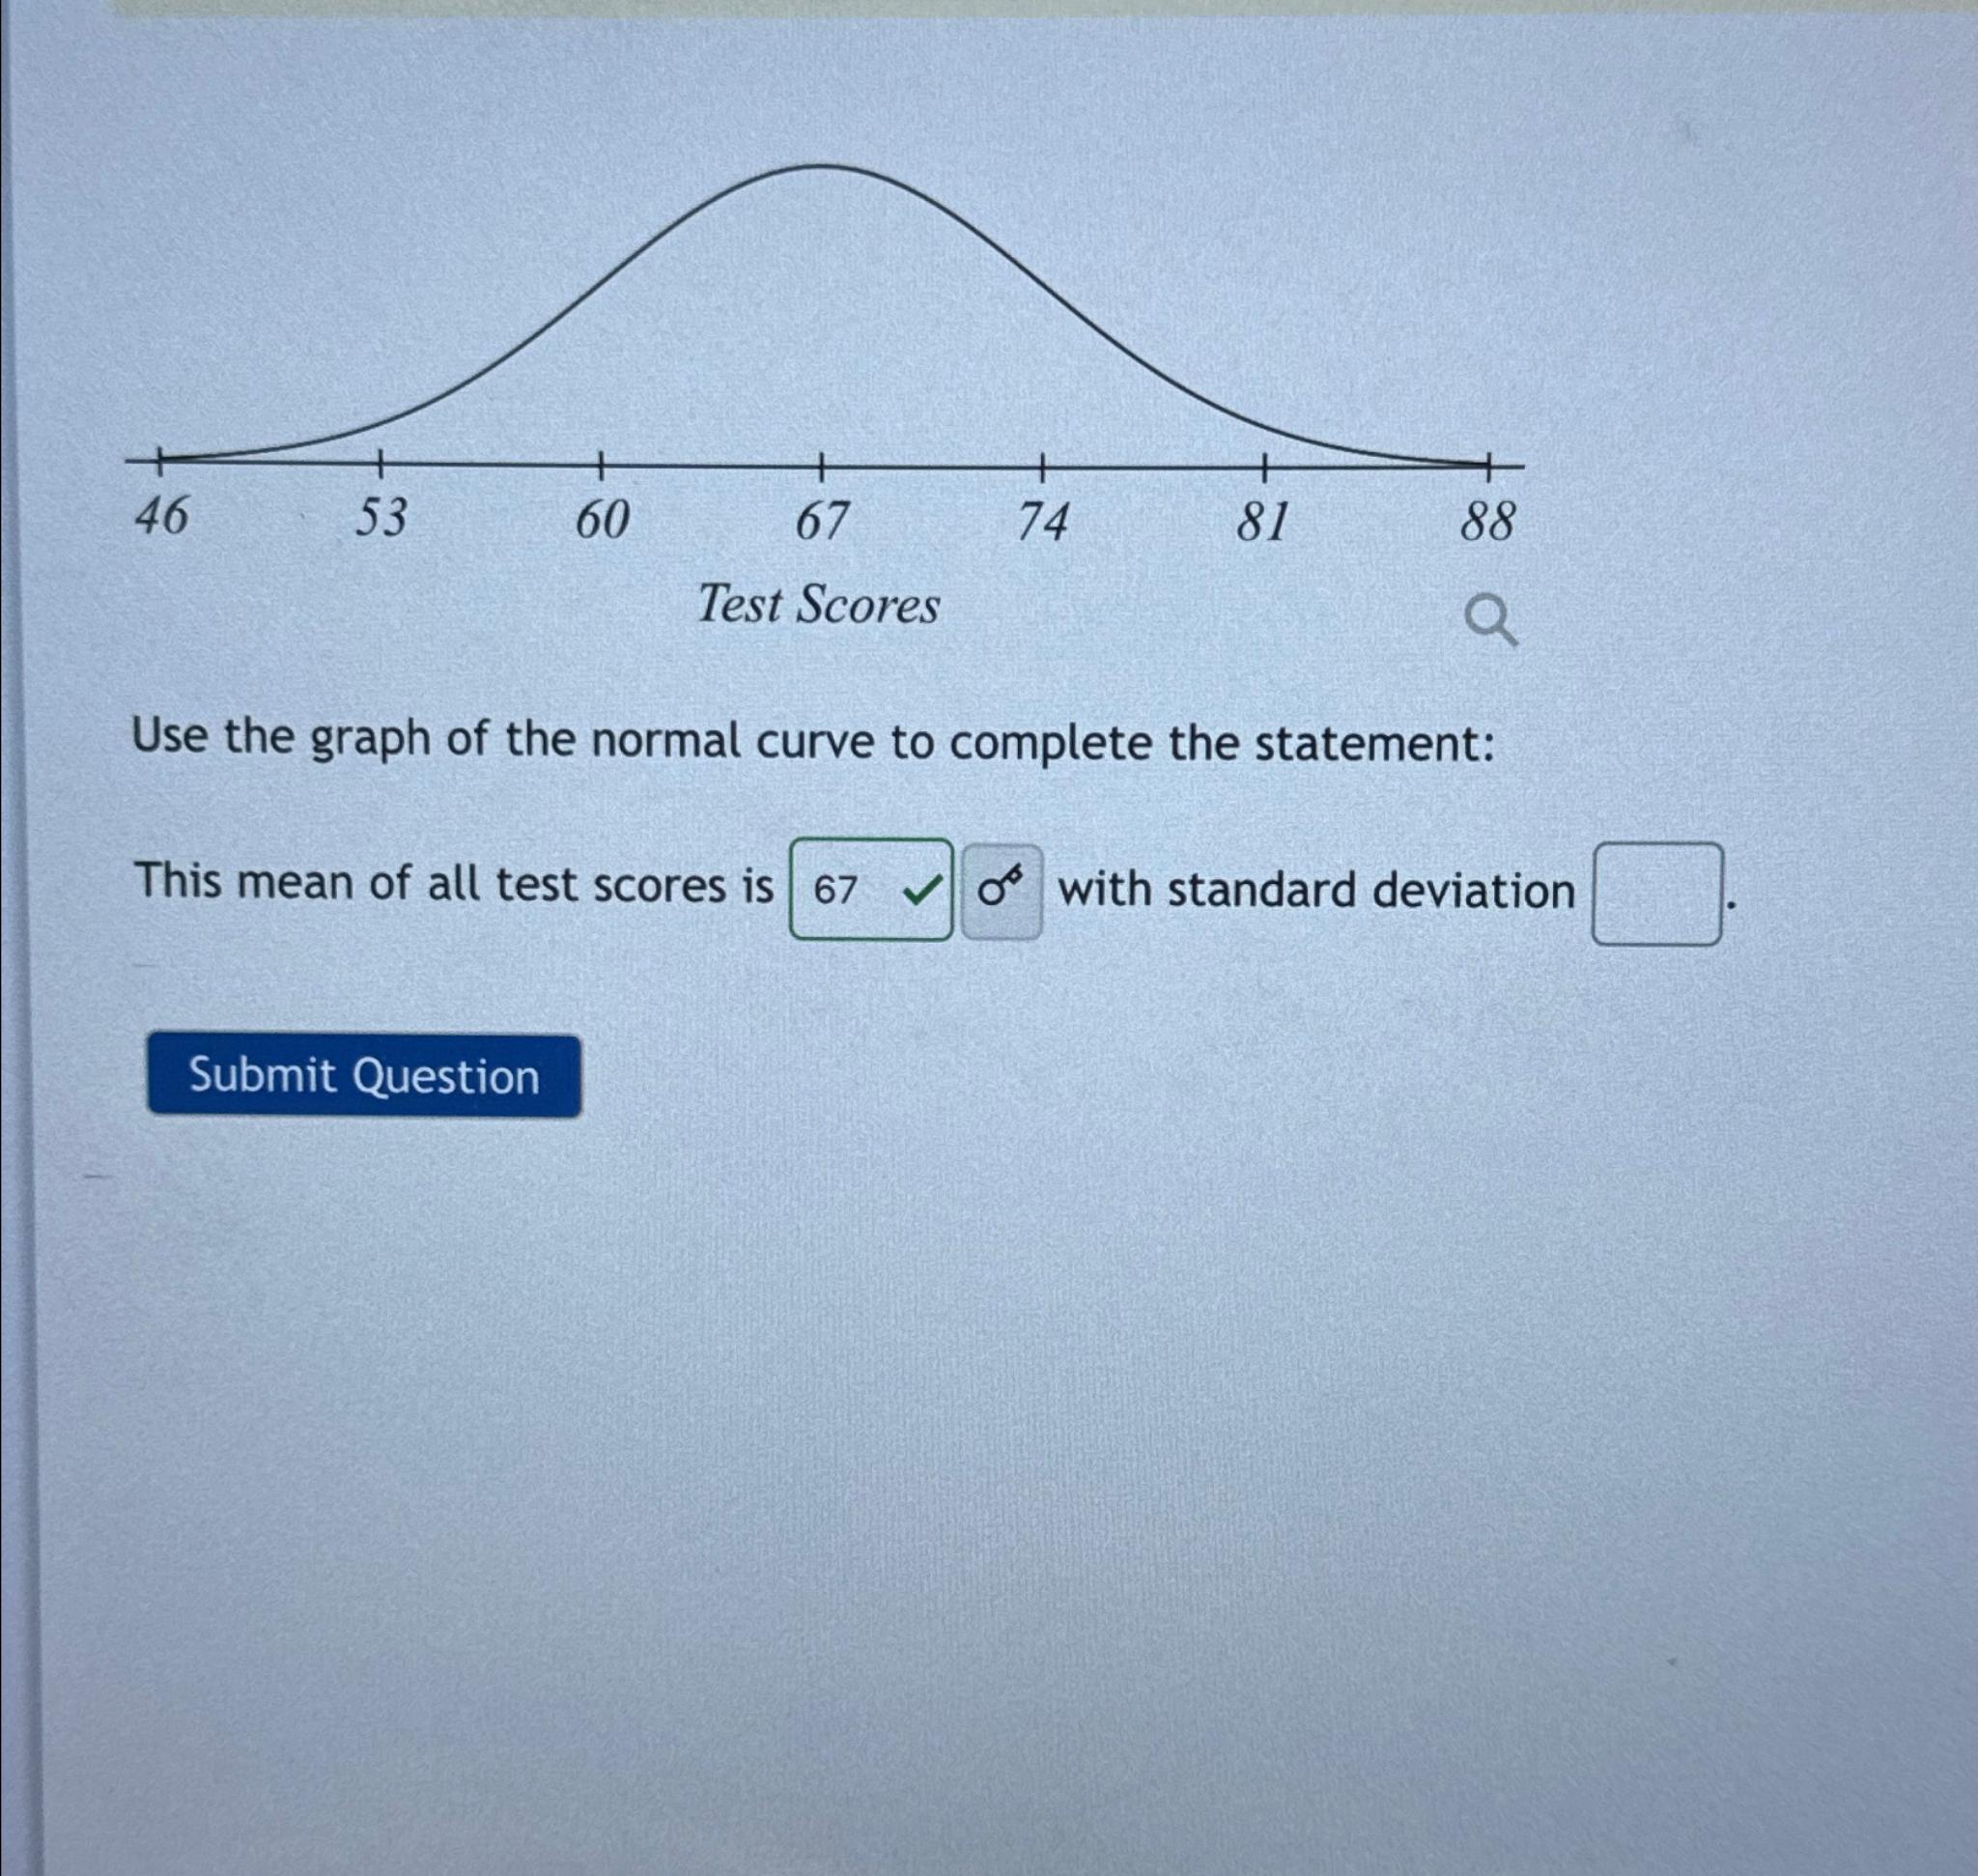
+ + 46 53 60 67 74 81 88 Test Scores Q Use the graph of the normal curve to complete the statement: This mean of all test scores is 67 o with standard deviation Submit Question
Step by Step Solution
There are 3 Steps involved in it
1 Expert Approved Answer
Step: 1 Unlock

Question Has Been Solved by an Expert!
Get step-by-step solutions from verified subject matter experts
Step: 2 Unlock
Step: 3 Unlock