

Question: 4.6 Given the LTL rate tariff in Table 4.10, compute the effective rate of a 3000-lb shipment and a 4200-lb shipment. Do the effective rates
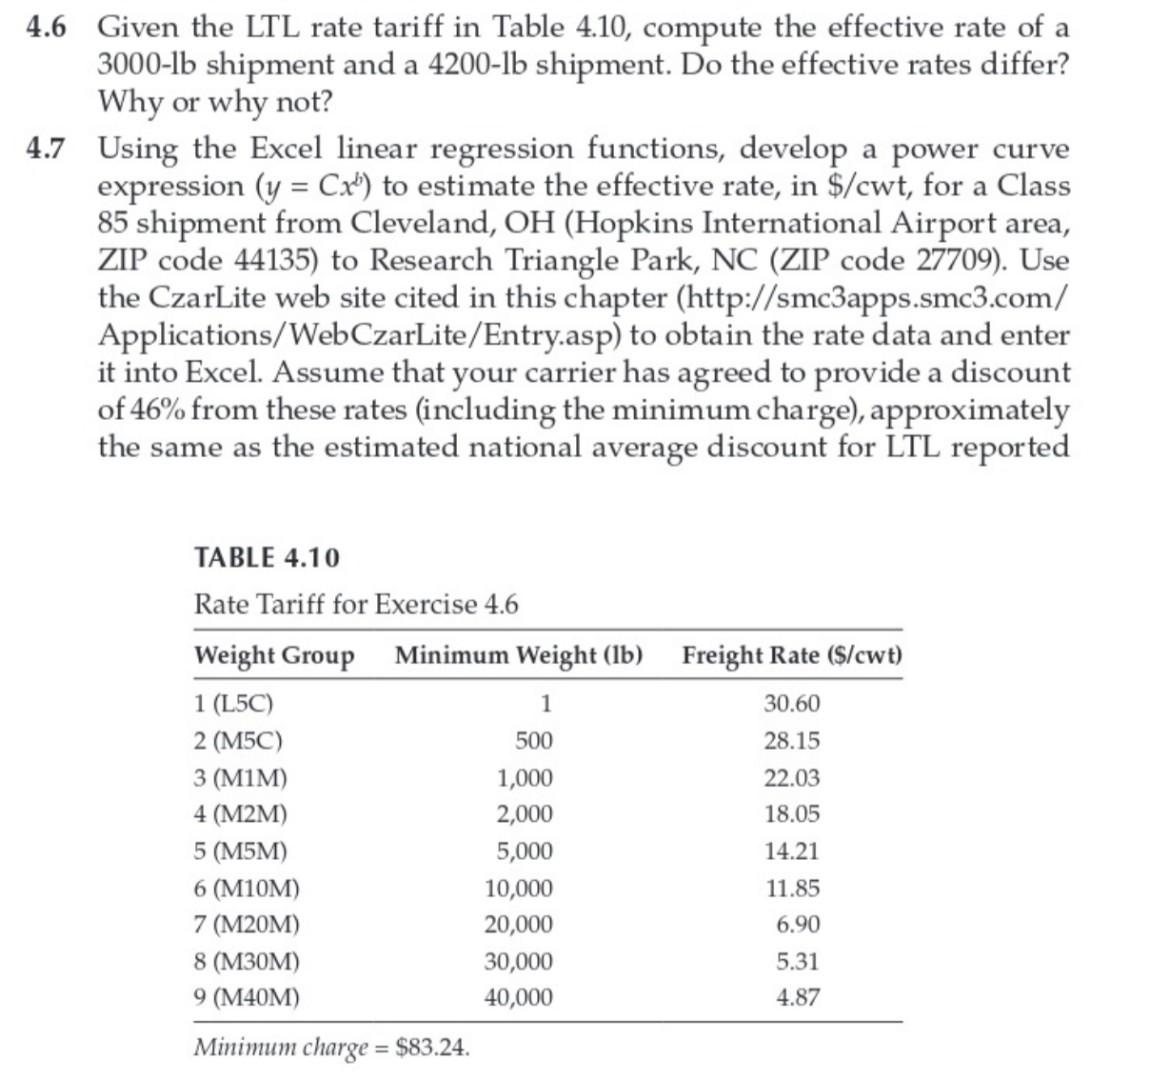
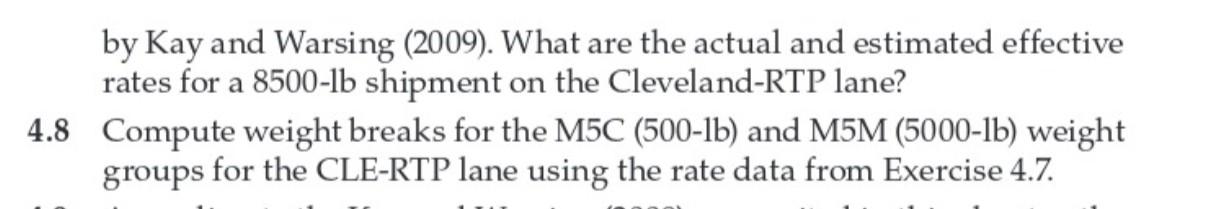
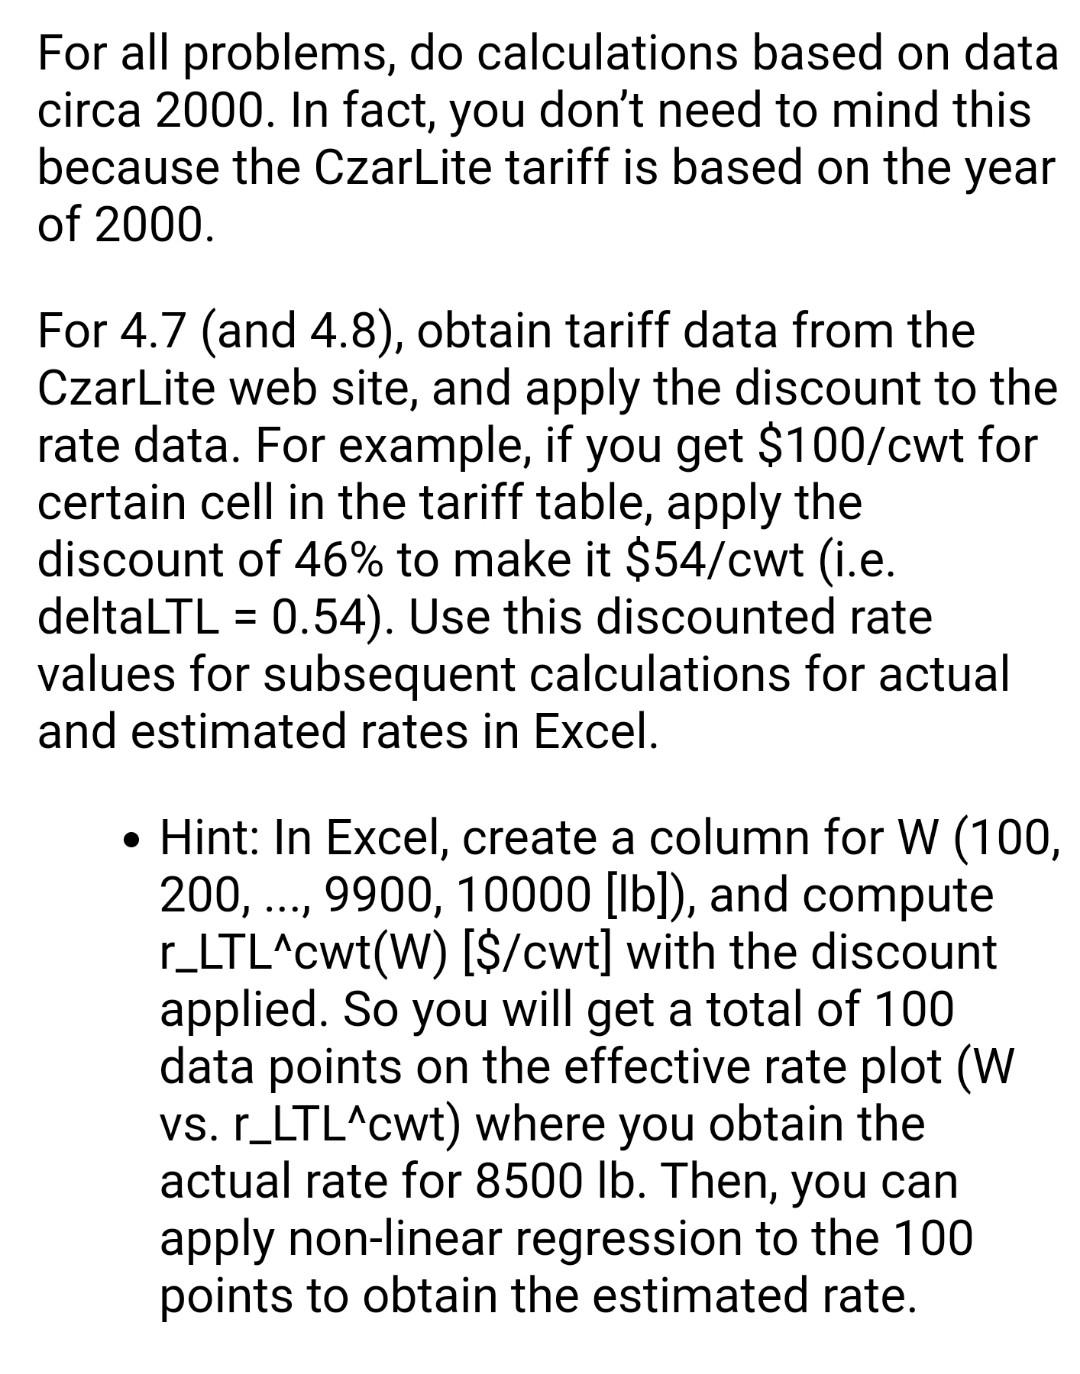
4.6 Given the LTL rate tariff in Table 4.10, compute the effective rate of a 3000-lb shipment and a 4200-lb shipment. Do the effective rates differ? Why or why not? 4.7 Using the Excel linear regression functions, develop a power curve expression (y=Cxb) to estimate the effective rate, in $/cwt, for a Class 85 shipment from Cleveland, OH (Hopkins International Airport area, ZIP code 44135) to Research Triangle Park, NC (ZIP code 27709). Use the CzarLite web site cited in this chapter (http://smc3apps.smc3.com/ Applications/WebCzarLite/Entry.asp) to obtain the rate data and enter it into Excel. Assume that your carrier has agreed to provide a discount of 46% from these rates (including the minimum charge), approximately the same as the estimated national average discount for LTL reported by Kay and Warsing (2009). What are the actual and estimated effective rates for a 8500-lb shipment on the Cleveland-RTP lane? 4.8 Compute weight breaks for the M5C (500-1b) and M5M (5000-lb) weight groups for the CLE-RTP lane using the rate data from Exercise 4.7. For all problems, do calculations based on data circa 2000. In fact, you don't need to mind this because the CzarLite tariff is based on the year of 2000. For 4.7 (and 4.8), obtain tariff data from the CzarLite web site, and apply the discount to the rate data. For example, if you get $100/cwt for certain cell in the tariff table, apply the discount of 46% to make it $54/ cwt (i.e. deltaLTL =0.54 ). Use this discounted rate values for subsequent calculations for actual and estimated rates in Excel. - Hint: In Excel, create a column for W (100, 200, .., 9900, 10000 [Ib]), and compute r_LTL^.cwt(W) [\$/cwt] with the discount applied. So you will get a total of 100 data points on the effective rate plot (W vs. r_LTL^ wt ) where you obtain the actual rate for 8500lb. Then, you can apply non-linear regression to the 100 points to obtain the estimated rate
Step by Step Solution
There are 3 Steps involved in it

Get step-by-step solutions from verified subject matter experts