

Question: 49,50 You want to develop a three-sigma R-chart. You know the average range is 12 based on several samples of size 6. Which of the
49,50 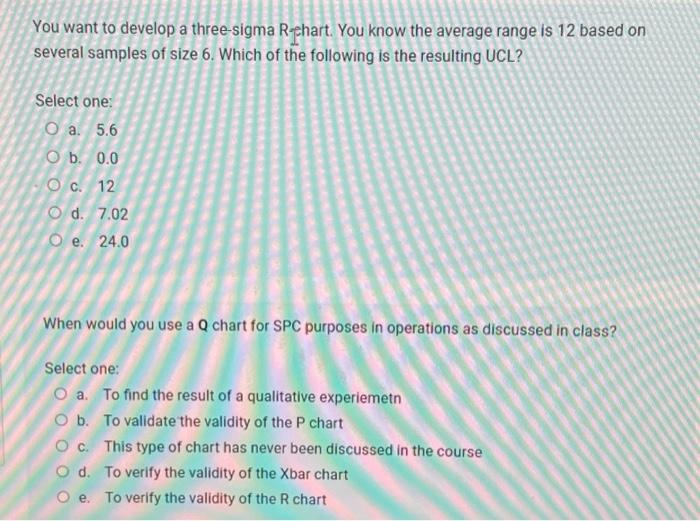
You want to develop a three-sigma R-chart. You know the average range is 12 based on several samples of size 6. Which of the following is the resulting UCL? Select one: O a. 5.6 Ob. 0.0 O c. 12 O d. 7.02 O e. 24.0 When would you use a Q chart for SPC purposes in operations as discussed in class? Select one: O a. To find the result of a qualitative experiemetn O b. To validate the validity of the P chart Oc. This type of chart has never been discussed in the course O d. To verify the validity of the Xbar chart O e. To verify the validity of the R chart
Step by Step Solution
There are 3 Steps involved in it
1 Expert Approved Answer
Step: 1 Unlock

Question Has Been Solved by an Expert!
Get step-by-step solutions from verified subject matter experts
Step: 2 Unlock
Step: 3 Unlock