

Question: 4a. Which of the following statements is true? check all that apply 1 If next year the company pursues option 1 and otherwise performs the
 4a. Which of the following statements is true?
check all that apply 1
- If next year the company pursues option 1 and otherwise performs the same as this year, it will increase next years overall turnover, but decrease its return on investment.
- If next year the company pursues option 1 and otherwise performs the same as this year, it will increase next years overall turnover and return on investment.
- If next year the company pursues option 1 and otherwise performs the same as this year, it will decrease next years overall turnover and return on investment.
- If next year the company pursues option 1 and otherwise performs the same as this year, it will decrease next years overall turnover, but increase its return on investment.
4b. Which of the following statements is true?
check all that apply 2
- If next year the company pursues option 2 and otherwise performs the same as this year, it will increase next years overall turnover, but decrease its return on investment.
- If next year the company pursues option 2 and otherwise performs the same as this year, it will increase next years overall turnover and return on investment.
- If next year the company pursues option 2 and otherwise performs the same as this year, it will decrease next years overall turnover and return on investment.
- If next year the company pursues option 2 and otherwise performs the same as this year, it will decrease next years overall turnover, but increase its return on investment.
4c. Which of the following statements is true?
check all that apply 3
- If next year the company pursues option 3 and otherwise performs the same as this year, it will increase next years overall margin, but decrease its return on investment.
- If next year the company pursues option 3 and otherwise performs the same as this year, it will increase next years overall margin and return on investment.
- If next year the company pursues option 3 and otherwise performs the same as this year, it will decrease next years overall margin and return on investment.
- If next year the company pursues option 3 and otherwise performs the same as this year, it will decrease next years overall margin, but increase its return on investment.
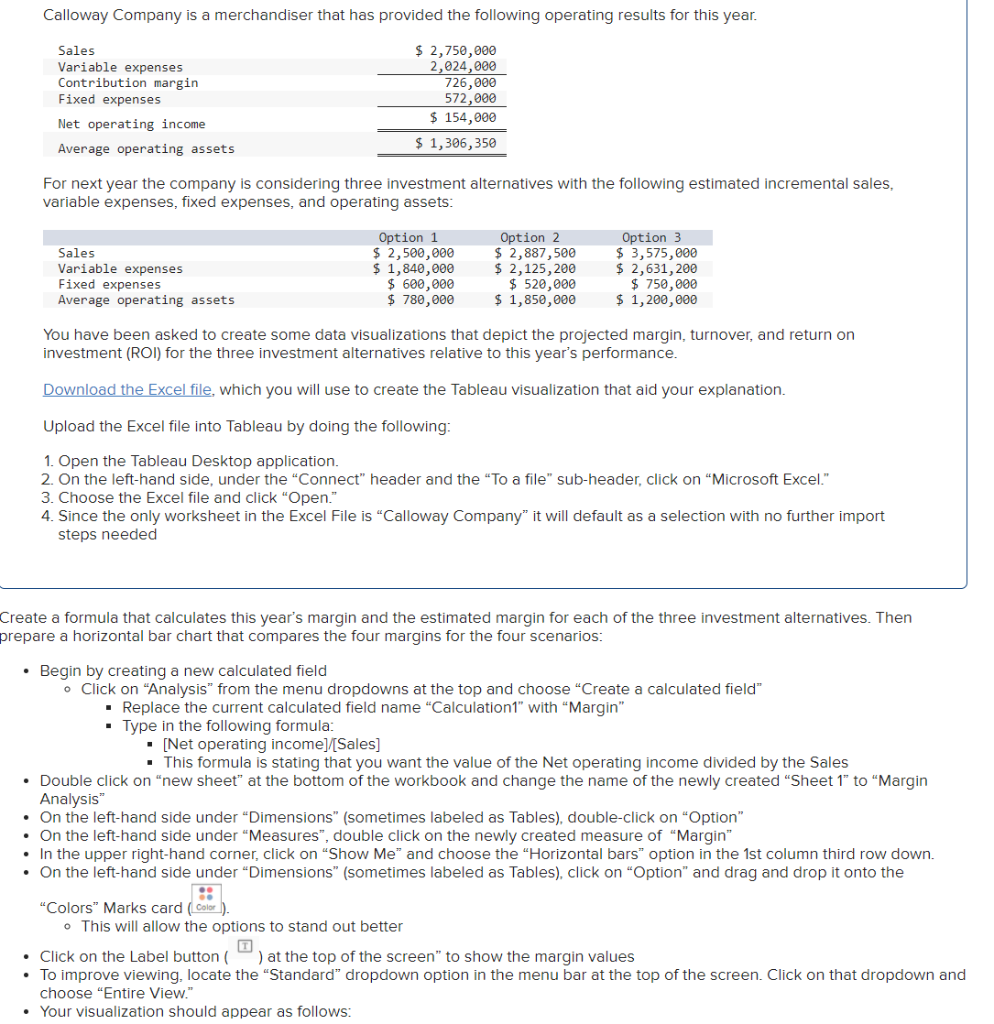
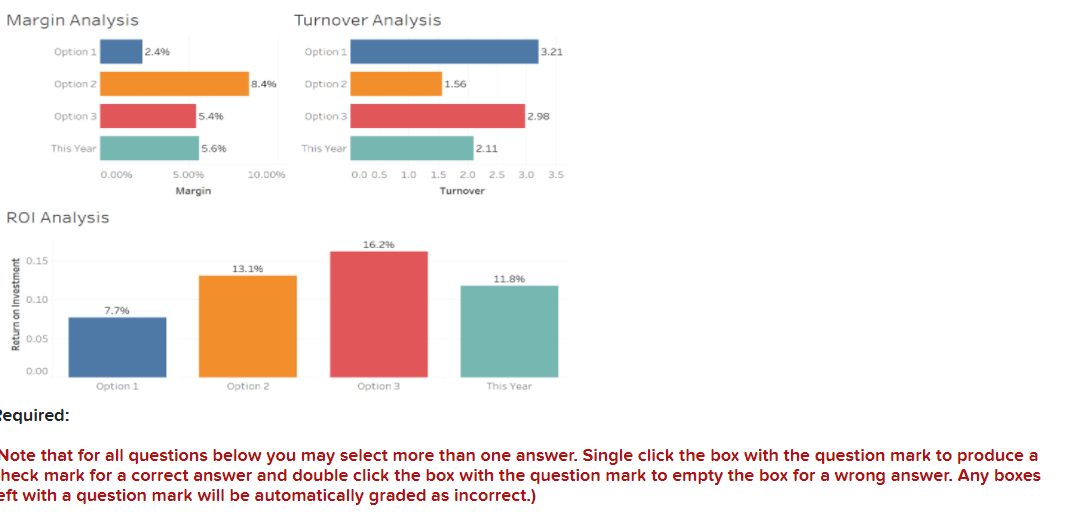
Calloway Company is a merchandiser that has provided the following operating results for this year. Sales Variable expenses Contribution margin Fixed expenses Net operating income Average operating assets $ 2,750,000 2,024,000 726,000 572,000 $ 154,000 $ 1,306, 350 For next year the company is considering three investment alternatives with the following estimated incremental sales, variable expenses, fixed expenses, and operating assets: Sales Variable expenses Fixed expenses Average operating assets Option 1 $ 2,500,000 $ 1,840,000 $ 600,000 $ 780,000 Option 2 $ 2,887,500 $ 2,125,200 $ 520,000 $ 1,850,000 Option 3 $ 3,575,000 $ 2,631,200 $ 750,000 $ 1,200,000 You have been asked to create some data visualizations that depict the projected margin, turnover, and return on investment (ROI) for the three investment alternatives relative to this year's performance. Download the Excel file, which you will use to create the Tableau visualization that aid your explanation. Upload the Excel file into Tableau by doing the following: 1. Open the Tableau Desktop ation. 2. On the left-hand side, under the "Connect" header and the "To a file" sub-header, click on "Microsoft Excel." 3. Choose the Excel file and click "Open." 4. Since the only worksheet in the Excel file is "Calloway Company" it will default as a selection with no further import steps needed Create a formula that calculates this year's margin and the estimated margin for each of the three investment alternatives. Then prepare a horizontal bar chart that compares the four margins for the four scenarios: Begin by creating a new calculated field Click on "Analysis from the menu dropdowns at the top and choose "Create a calculated field" Replace the current calculated field name "Calculation1" with Margin" Type in the following formula - [Net operating income)/(Sales] This formula is stating that you want the value of the Net operating income divided by the Sales Double click on "new sheet" at the bottom of the workbook and change the name of the newly created "Sheet 1" to "Margin Analysis" On the left-hand side under "Dimensions" (sometimes labeled as Tables), double-click on "Option" . On the left-hand side under "Measures, double click on the newly created measure of "Margin" In the upper right-hand corner, click on Show Me" and choose the "Horizontal bars" option in the 1st column third row down. On the left-hand side under "Dimensions" (sometimes labeled as Tables), click on "Option" and drag and drop it onto the . "Colors" Marks card ( Color ). o This will allow the options to stand out better Click on the Label button ) at the top of the screen" to show the margin values To improve viewing, locate the "Standard" dropdown option in the menu bar at the top of the screen. Click on that dropdown and choose "Entire View." Your visualization should appear as follows: Turnover Analysis Margin Analysis Option 1 1 2.496 Option 1 3.21 Option 2 8.496 Option 2 2 1.56 Option 3 5.496 Option 3 2.98 This Year 5.696 This Year 2.11 0.0096 10.000 0.0 0.5 1.0 5.00% Margin 1.5 2.0 2.5 3.0 3.5 Turnover ROI Analysis 16.296 0.15 13.196 11.8% 0.10 7.796 0.05 0.00 Option 1 Option 2 2 Option 3 3 This Year equired: Note that for all questions below you may select more than one answer. Single click the box with the question mark to produce a heck mark for a correct answer and double click the box with the question mark to empty the box for a wrong answer. Any boxes eft with a question mark will be automatically graded as incorrect.)
Step by Step Solution
There are 3 Steps involved in it

Get step-by-step solutions from verified subject matter experts