

Question: 4.In the lab, we have created the VBA function, myConstantCorr, to calculate the constant correlation variance-covariance matrix. This function takes two parameters: a matrix of
4.In the lab, we have created the VBA function, myConstantCorr, to calculate the constant correlation variance-covariance matrix. This function takes two parameters: a matrix of historical returns and the average correlation. Let us get rid of the second parameter and write a new VBA function, ConstantRhoHistthat only takes one parameter: the matrix of historical returns. The average correlation among all stocks should be calculated inside this function(include all correlations less than 100%). Use ConstantRhoHistand the return data in Tab Q4to construct the constant correlationvar-cov matrix.Use Option Base 1 to finish this question. (Hint: you can reuse any functions we derived in the lab.)
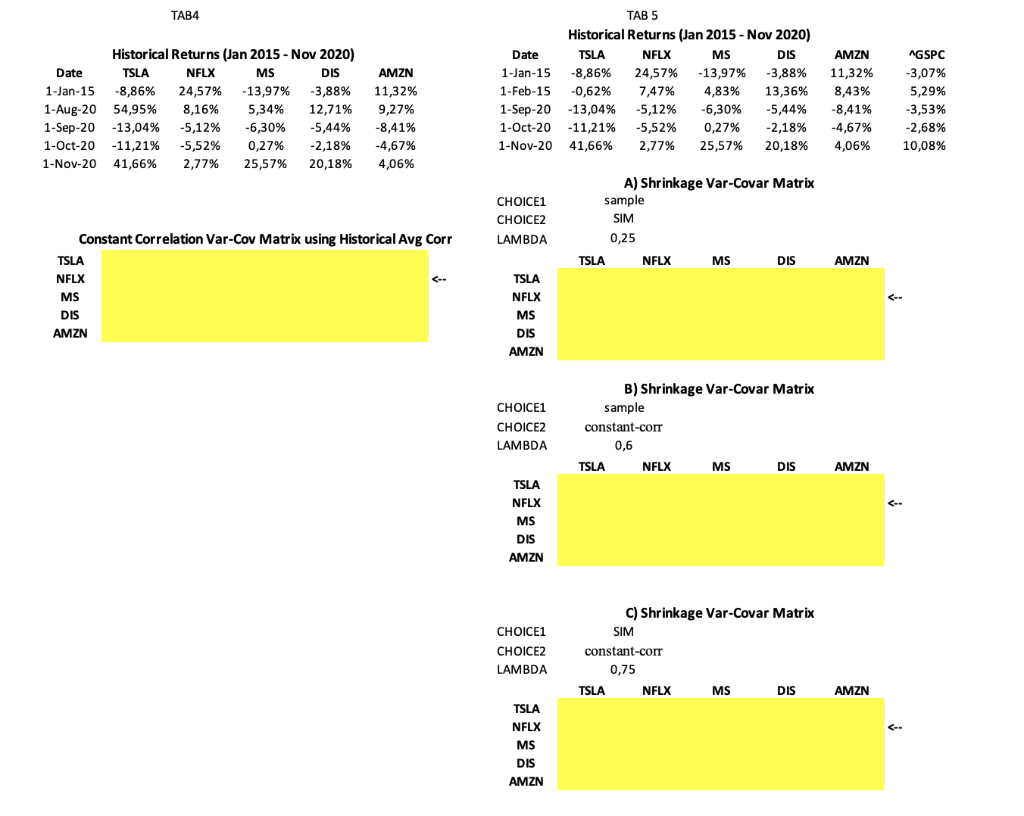
5.Using the functions ConstantRhoHist from step 4 (which computes the constant correlation var-covar matrix) and the functions SIM and VarCovar (which compute the single index model and sample var-covar matrices used in prior labs), create a new function named Shrinkage(ASSET_RETURNS, CHOICE1,CHOICE2,LAMBDA,[MKT_RET]). This function creates the Shrinkage variance-covariance matrix seen in Topic2 that gives weight LAMBDA to the var-covar matrix specified in CHOICE1 and weight (1-LAMBDA) to the var-covar matrix specified in CHOICE2.
The choices specified in the input parameters CHOICE1and CHOICE2can be sample, SIM, or constant-corr to indicate which variance-covariance matrix to choose from.The ASSET_RETURNSis a matrix of asset returns.Finally, the input MKT_RET is an optional parameter that provides the series of historical returns of the stock market portfolio that is needed if computing the SIM var-covar matrix.
Use the Shrinkage function and the asset and market return data in Tab Q5to estimate the shrinkage variance-covariance matrices that result from the following choices:
a)CHOICE1=sample , CHOICE2=SIM , LAMBDA=0.25
b)CHOICE1=sample , CHOICE2=constant-corr , LAMBDA=0.60
c)CHOICE1=SIM , CHOICE2=constant-corr , LAMBDA=0.75
Lastly, when calling upon your function make sure to only add the optional parameter as an input to your function if needed for the computation, otherwise leave it blank.
TAB4 Historical Returns (Jan 2015 - Nov 2020) Date TSLA NFLX MS DIS 1-Jan-15 -8,86% 24,57% -13,97% -3,88% 1-Aug-20 54,95% 8,16% 5,34% 12,71% 1-Sep-20 -13,04% -5,12% -6,30% -5,44% 1-Oct-20 -11,21% -5,52% 0,27% -2,18% 1-Nov-20 41,66% 2,77% 25,57% 20,18% AMZN 11,32% 9,27% -8,41% -4,67% 4,06% TAB 5 Historical Returns (Jan 2015 - Nov 2020) Date TSLA NFLX MS DIS 1-Jan-15 -8,86% 24,57% -13,97% -3,88% 1-Feb-15 -0,62% 7,47% 4,83% 13,36% 1-Sep-20 -13,04% -5,12% -6,30% -5,44% 1-Oct-20 -11,21% -5,52% 0,27% -2,18% 1-Nov-20 41,66% 2,77% 25,57% 20,18% AMZN 11,32% 8,43% -8,41% -4,67% 4,06% AGSPC -3,07% 5,29% -3,53% -2,68% 10,08% CHOICE1 CHOICE2 LAMBDA A) Shrinkage Var-Covar Matrix sample SIM 0,25 TSLA NFLX MS DIS AMZN Constant Correlation Var-Cov Matrix using Historical Avg Corr TSLA NFLX MS DIS AMZN TSLA NFLX MS DIS AMZN CHOICE1 CHOICE2 LAMBDA B) Shrinkage Var-Covar Matrix ) sample constant-corr 0,6 TSLA NFLX MS DIS AMZN TSLA NFLX MS DIS AMZN CHOICE1 CHOICE2 LAMBDA C) Shrinkage Var-Covar Matrix SIM constant-corr 0,75 TSLA NFLX MS DIS AMZN TSLA NFLX MS DIS AMZN TAB4 Historical Returns (Jan 2015 - Nov 2020) Date TSLA NFLX MS DIS 1-Jan-15 -8,86% 24,57% -13,97% -3,88% 1-Aug-20 54,95% 8,16% 5,34% 12,71% 1-Sep-20 -13,04% -5,12% -6,30% -5,44% 1-Oct-20 -11,21% -5,52% 0,27% -2,18% 1-Nov-20 41,66% 2,77% 25,57% 20,18% AMZN 11,32% 9,27% -8,41% -4,67% 4,06% TAB 5 Historical Returns (Jan 2015 - Nov 2020) Date TSLA NFLX MS DIS 1-Jan-15 -8,86% 24,57% -13,97% -3,88% 1-Feb-15 -0,62% 7,47% 4,83% 13,36% 1-Sep-20 -13,04% -5,12% -6,30% -5,44% 1-Oct-20 -11,21% -5,52% 0,27% -2,18% 1-Nov-20 41,66% 2,77% 25,57% 20,18% AMZN 11,32% 8,43% -8,41% -4,67% 4,06% AGSPC -3,07% 5,29% -3,53% -2,68% 10,08% CHOICE1 CHOICE2 LAMBDA A) Shrinkage Var-Covar Matrix sample SIM 0,25 TSLA NFLX MS DIS AMZN Constant Correlation Var-Cov Matrix using Historical Avg Corr TSLA NFLX MS DIS AMZN TSLA NFLX MS DIS AMZN CHOICE1 CHOICE2 LAMBDA B) Shrinkage Var-Covar Matrix ) sample constant-corr 0,6 TSLA NFLX MS DIS AMZN TSLA NFLX MS DIS AMZN CHOICE1 CHOICE2 LAMBDA C) Shrinkage Var-Covar Matrix SIM constant-corr 0,75 TSLA NFLX MS DIS AMZN TSLA NFLX MS DIS AMZN
Step by Step Solution
There are 3 Steps involved in it

Get step-by-step solutions from verified subject matter experts