

Question: 4of4 c) Now in four different line diagrams, plot ination and long-term interest rate for the four countries, mentioned above. Is there any country, which
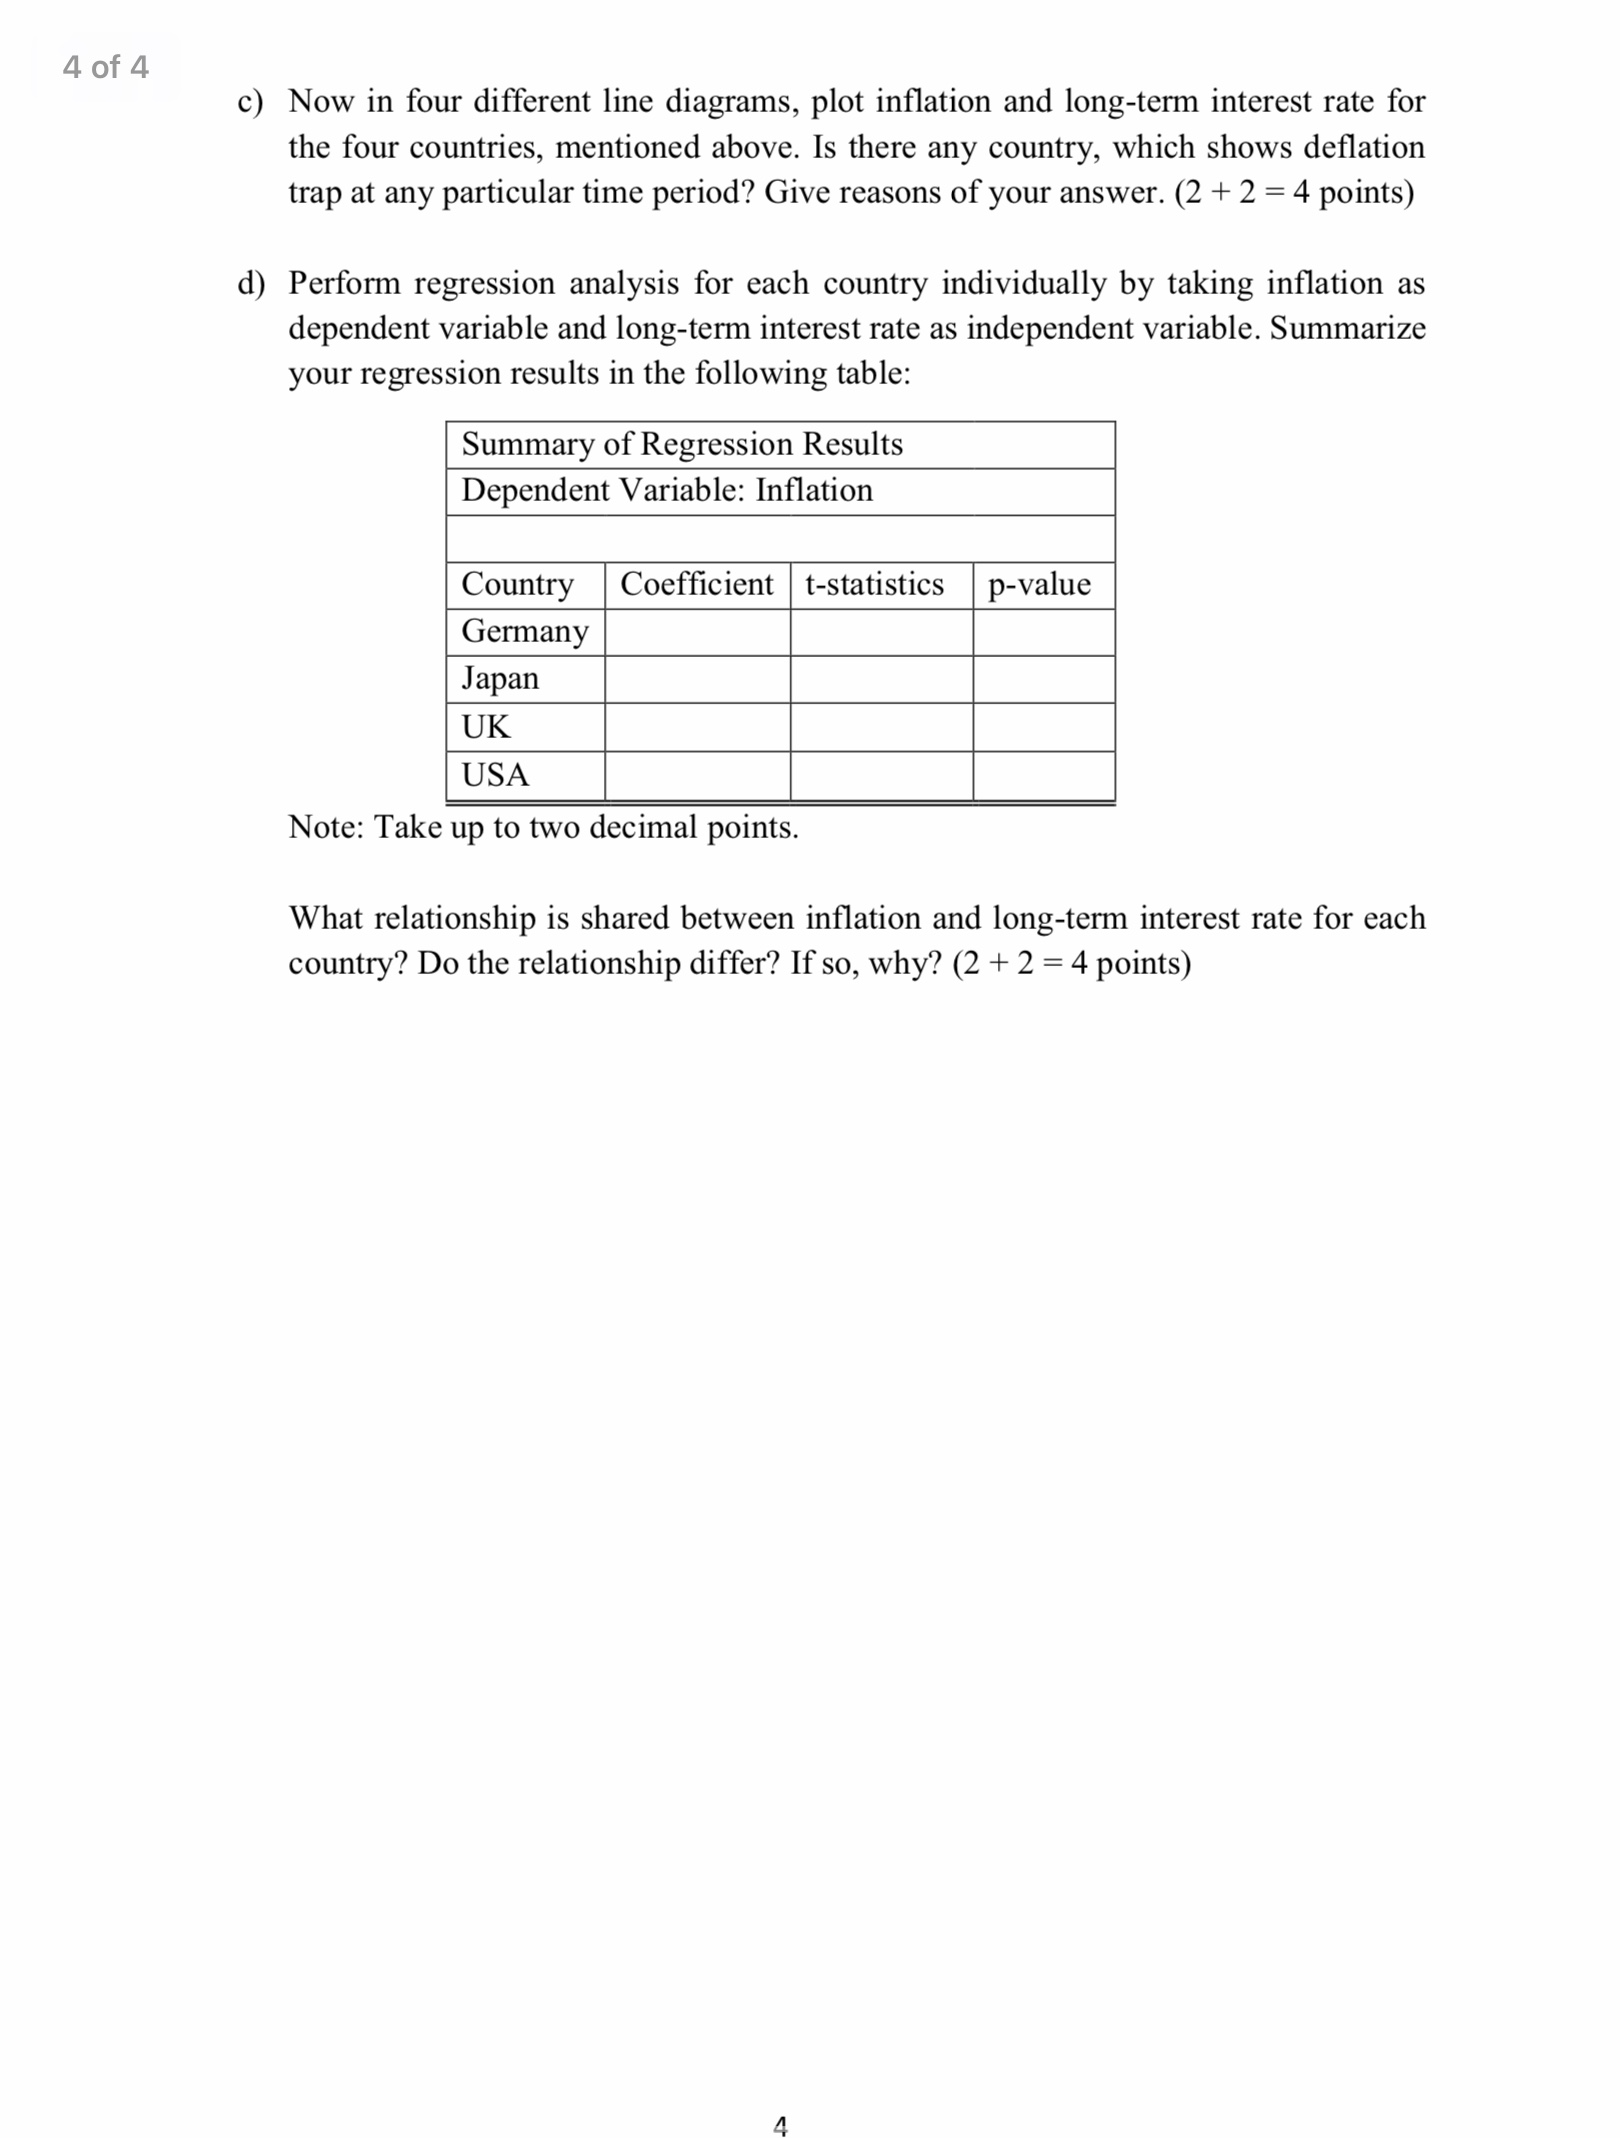
4of4 c) Now in four different line diagrams, plot ination and long-term interest rate for the four countries, mentioned above. Is there any country, which shows deation trap at any particular time period? Give reasons of your answer. (2 + 2 = 4 points) d) Perform regression analysis for each country individually by taking ination as dependent variable and long-term interest rate as independent variable. Summarize your regression results in the following table: Note: Take up to two decimal points. What relationship is shared between ination and long-term interest rate for each country? Do the relationship differ? If so, why? (2 + 2 = 4 points) 3 of 4 show the effect of such fall in AD, and the Central Bank's response to bring the economy back to the medium-run equilibrium. (4 points) 4. [Total points: 6] a) Derive the slopes of Phillip's curve (PC, thereafter) and the Monetary Rule (MR, henceforth) curve. What economic implication do you get from these slopes of these two curves? (1 + 1+ 1+ 1 = 4 points) b) Consider the utility loss function of the central bank; where it only cares about reducing the output gap. Now, due to the ongoing pandemic, economy is going through the recession along with the disinflation. In a graph consisting the utility loss function of CB, show how CB will accommodate the recession? (2 points) 5. [Total points: 10] a) Think about the great financial crisis (GFC) in late 2000s. i) According to you what kind of shock it was - AD/AS? (1 point) ii) With 3-equation model (IS-PC-MR) explain the consequences of the crisis on worldwide output, unemployment, and inflation. Make sure to draw the graphs (IS, WS-PS, MR-PC) to explain the scenario. (3 points) iii) In the above diagram, show the optimal response of the Central Bank to deal with such recession. (2 points) iv) Mention whether the shock is permanent or temporary. (1 point) b) Do you think the crisis leads the world economy into deflation trap? With the reference of your previous diagrams, explain your answer properly. (3 points) 6. [Total points: 12] From OECD statistics collect monthly data of long-term interest rate and inflation (CPI growth rate) from January, 2006 to July, 2020 for four countries, namely - Germany, Japan, United Kingdom, and United States. a) In a line diagram plot the long-term interest rate for these four countries. What's your interpretation from the graph? More specifically, check if the long-term interest rate reaches to its lower bound zero for any of these countries. If so, state the specific reason. (1 + 1 = 2 points) b) In a line diagram plot the inflation rate for these four countries. What's your interpretation from the graph? Just like part - (a), check if any country experiences disinflation. If so, what's the reason behind that? (1 + 1 = 2 points)2 of 4 2. [Total points: 13] a) b) In a closed economy, consider the aggregate income is y, consumption (C) is the sum of autonomous consumption and the part of consumption that depends on the disposable income, xed investment is I, and government spending is G. If the country's tax rate is t, then what is the amount of private savings and public savings? From the national income identity for the above economy, show that the national savings is the sum of private savings and public savings, and is identical to the xed investment. (1 + l + 2 = 4 points) Note: If you derive the identity from lump-sum taxes, you have to estimate the amount of lump-sum tax given the information above. Now, for the same economy autonomous consumption is Rs. 1200, marginal propensity to consume is 0.8, tax rate is 0.2, xed investment is Rs. 1400, and the government spending is Rs. 1000. i) What's the level of output in good's market? (2 points) ii) Now, a credit card theft reduces the marginal propensity to consume to 0.4. What will be the new output level at good's market? (2 points) iii) Compare the savings in old and new market equilibria, where the savings is exactly the amount of national savings, you derived in part (a). (3 points) iv) Do you think the savings are same in old and new good's market equilibria? Provide appropriate reasoning for your answer. Does the economy better off after the rise in marginal propensity to save? (2 points) 3. [Total points: 10] a) b) d) A fall in the unemployment benet would reduce the intercept of both the labour supply and the wage-setting curve. In a graph with labour supply, WS and PS explain how this incident will affect the decision of the rms and the equilibrium unemployment? State why this happens. (Make sure to mention the axes and direction of the shifts of the curves) (2 points) Explain with 3-equation model along with graphical explanation how the recent amendment in \"Essential commodity act\" in India will create a shock in the economy. State which curve will shift and what would be the consequences of this enforcement on ination, output and unemployment in the current year. (2 points) Suppose, RBI has the perfect foresight and it one period it brings back the economy to stable ination and output due to the shock, mentioned in part (b). Show the adjustment procedure of the Central Bank in the diagram in part (b). (2 points) Now due to RBI's intervention and the shock itself, suppose there is a temporary fall in the aggregate demand in next period, say period l . In the previous diagram 1 of 4 1. [Total points: 9] Consider the Keynesian cross model in a closed economy where the private consumption not only depends on tax rate but also depends on the real interest rate, decided by the Central Bank of the country. Specically, the planned expenditure is given by the following equation: )1\" =c0+c1(1t)yc2r+l+6 where, Consumption: C = co + c1(1 t)y czr a) Derive the slope of the planned expenditure lnction and explain the economic implication of it. Show both mathematically and graphically how a fall in the tax by At would shift the planned expenditure and change the equilibrium output level of the country in good's market (Make sure to mention the axes and the direction of the shift of the curves). How the change in the consumption pattern from the conventional Keynesian cross model would alter the tax multiplier? (2 + 2 + 1 = 5 points) Now, for this economy the IS-curve is given by y=c0+cl(1t)yc2r+aOa1r+6 where, Investment] = a0 alr b) Derive the slope of IS curve, and compare that with the slope of conventional IS curve. Show the comparison both mathematically and graphically with proper explanations. (2 + 2 = 4 points)
Step by Step Solution
There are 3 Steps involved in it

Get step-by-step solutions from verified subject matter experts