

Question: 5 . ) ( 1 2 points ) For the following daily stock price chart, which includes the MACD technical indictor, the Relative Strength (
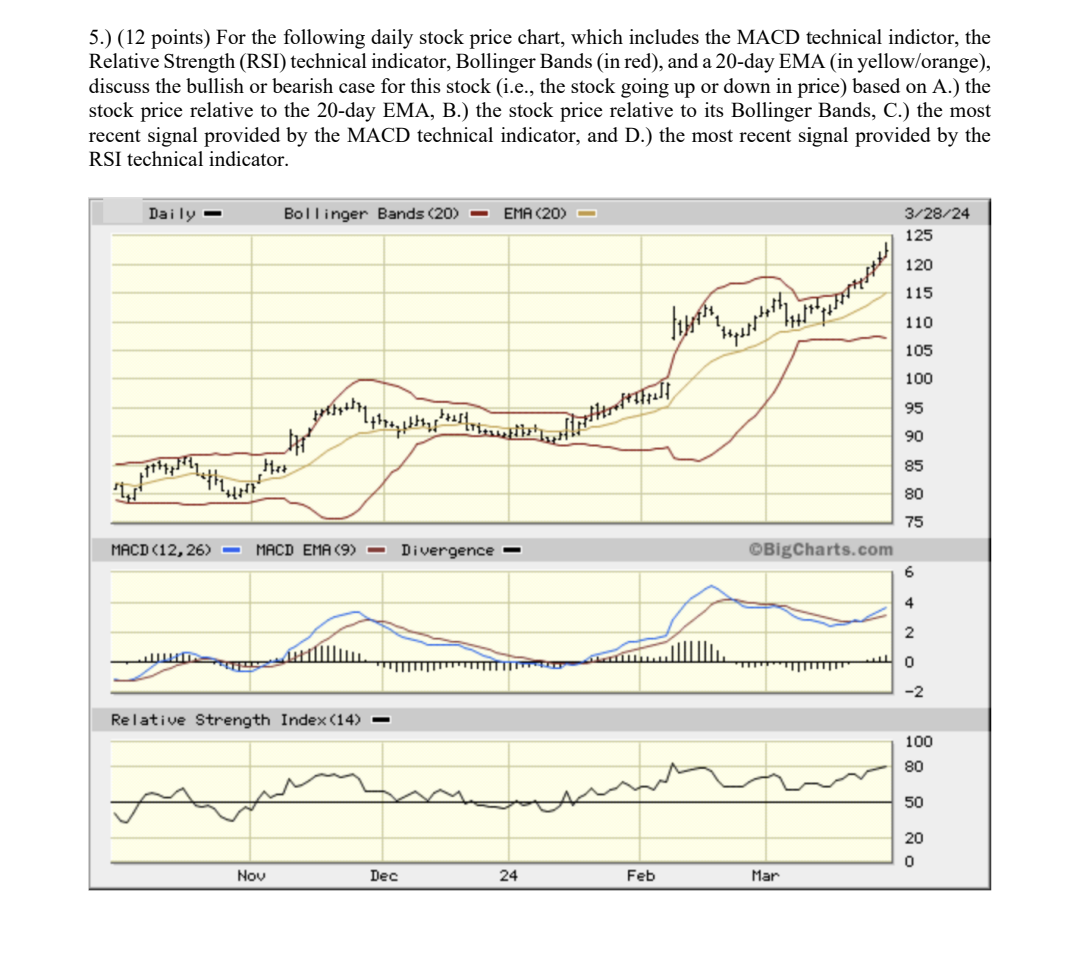
points For the following daily stock price chart, which includes the MACD technical indictor, the Relative Strength RSI technical indicator, Bollinger Bands in red and a day EMA in yelloworange discuss the bullish or bearish case for this stock ie the stock going up or down in price based on A the stock price relative to the day EMA, B the stock price relative to its Bollinger Bands, C the most recent signal provided by the MACD technical indicator, and D the most recent signal provided by the RSI technical indicator.
Clarification on B
Step by Step Solution
There are 3 Steps involved in it
1 Expert Approved Answer
Step: 1 Unlock

Question Has Been Solved by an Expert!
Get step-by-step solutions from verified subject matter experts
Step: 2 Unlock
Step: 3 Unlock