

Question: = 5. (10 marks) Consider the test for sphericity H. : S = oI vs H :#oI, where E 2 is a px p matrix.
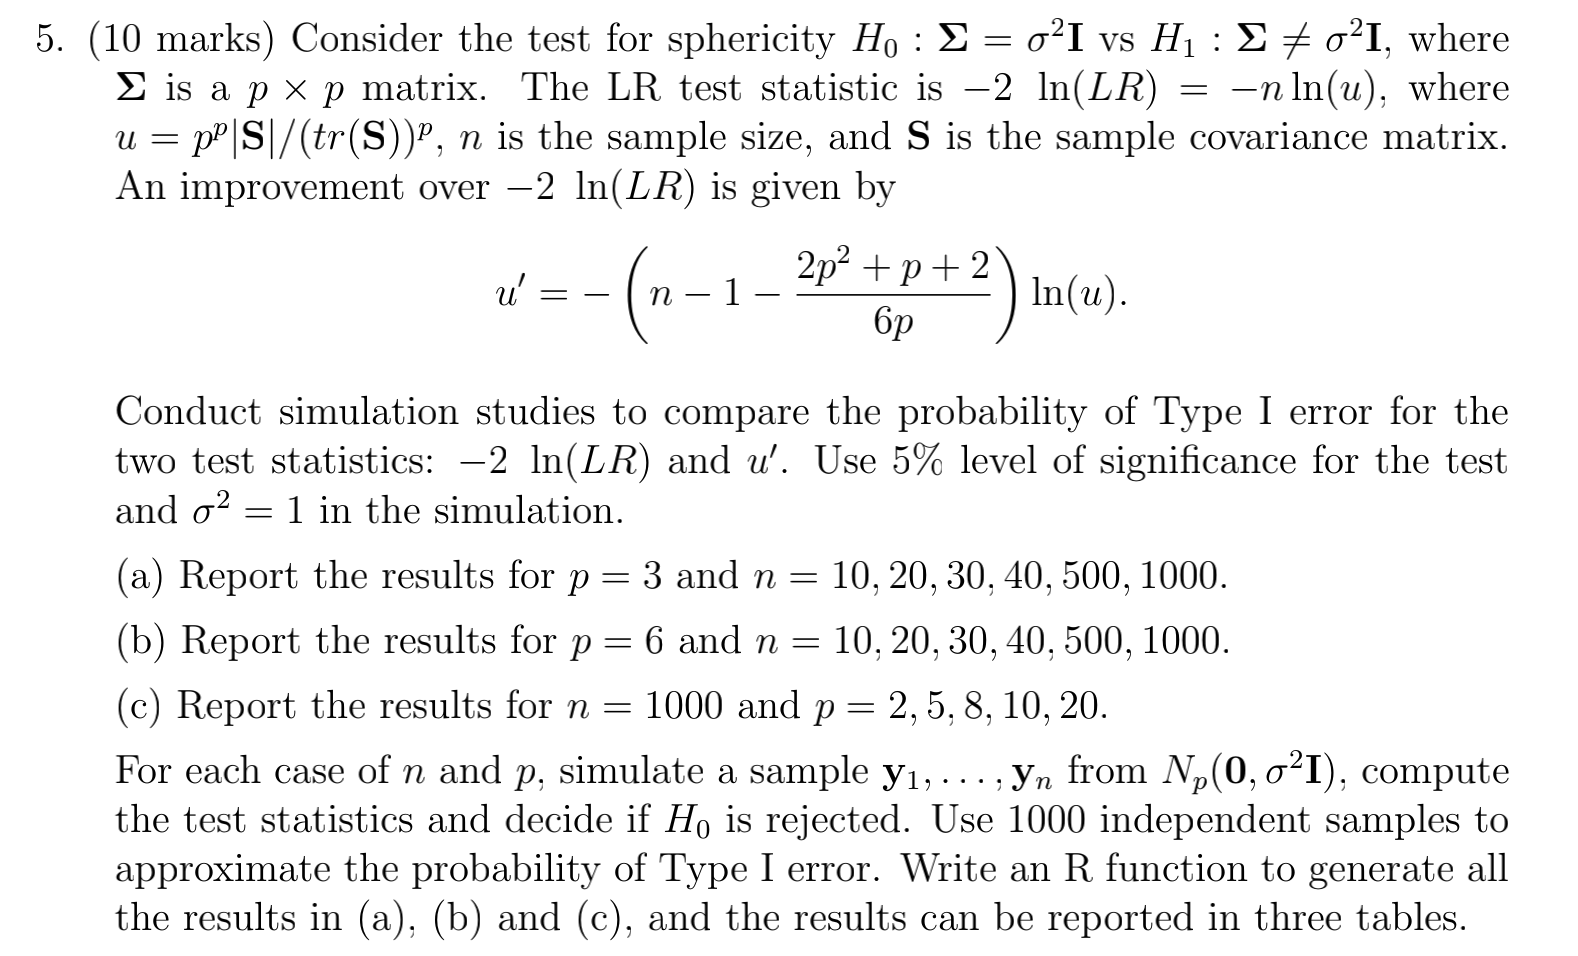
= 5. (10 marks) Consider the test for sphericity H. : S = oI vs H :#oI, where E 2 is a px p matrix. The LR test statistic is -2 In(LR) = -n In(u), where u = pp|S/(tr(S))", n is the sample size, and S is the sample covariance matrix. An improvement over 2 In(LR) is given by = u -(n-1 1 2p2 + p +2 6p In(u). = = Conduct simulation studies to compare the probability of Type I error for the two test statistics: 2 ln(LR) and u'. Use 5% level of significance for the test and o2 = 1 in the simulation. (a) Report the results for p=3 and n = 10, 20, 30, 40, 500, 1000. 3 (b) Report the results for p = 6 and n = 10, 20, 30, 40, 500, 1000. (c) Report the results for n = 1000 and p= 2,5,8, 10, 20. For each case of n and p, simulate a sample y1, ..., yn from N,(0,oI), compute the test statistics and decide if H, is rejected. Use 1000 independent samples to approximate the probability of Type I error. Write an R function to generate all the results in (a), (b) and (c), and the results can be reported in three tables. = = 5. (10 marks) Consider the test for sphericity H. : S = oI vs H :#oI, where E 2 is a px p matrix. The LR test statistic is -2 In(LR) = -n In(u), where u = pp|S/(tr(S))", n is the sample size, and S is the sample covariance matrix. An improvement over 2 In(LR) is given by = u -(n-1 1 2p2 + p +2 6p In(u). = = Conduct simulation studies to compare the probability of Type I error for the two test statistics: 2 ln(LR) and u'. Use 5% level of significance for the test and o2 = 1 in the simulation. (a) Report the results for p=3 and n = 10, 20, 30, 40, 500, 1000. 3 (b) Report the results for p = 6 and n = 10, 20, 30, 40, 500, 1000. (c) Report the results for n = 1000 and p= 2,5,8, 10, 20. For each case of n and p, simulate a sample y1, ..., yn from N,(0,oI), compute the test statistics and decide if H, is rejected. Use 1000 independent samples to approximate the probability of Type I error. Write an R function to generate all the results in (a), (b) and (c), and the results can be reported in three tables. =
Step by Step Solution
There are 3 Steps involved in it

Get step-by-step solutions from verified subject matter experts