

Question: 5. (10 points) The following table indicates the loss frequency and severity distributions within a year due to operational risk. a) Compute the expected total
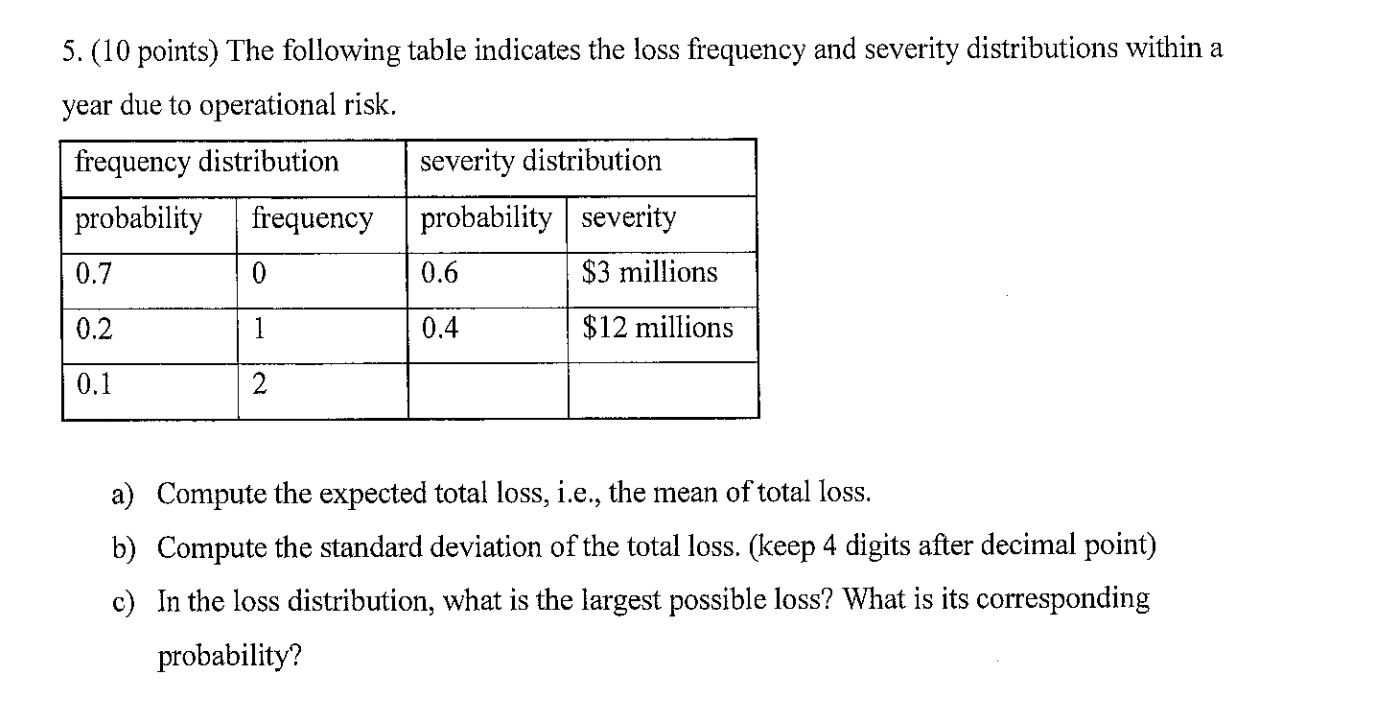
5. (10 points) The following table indicates the loss frequency and severity distributions within a year due to operational risk. a) Compute the expected total loss, i.e., the mean of total loss. b) Compute the standard deviation of the total loss. (keep 4 digits after decimal point) c) In the loss distribution, what is the largest possible loss? What is its corresponding probability? 5. (10 points) The following table indicates the loss frequency and severity distributions within a year due to operational risk. a) Compute the expected total loss, i.e., the mean of total loss. b) Compute the standard deviation of the total loss. (keep 4 digits after decimal point) c) In the loss distribution, what is the largest possible loss? What is its corresponding probability
Step by Step Solution
There are 3 Steps involved in it

Get step-by-step solutions from verified subject matter experts