

Question: 5 10 Receiver Operating Characteristic (ROC) curve uses a graphical approach to display the tradeoff between detection rate and false alarm rate. In order to
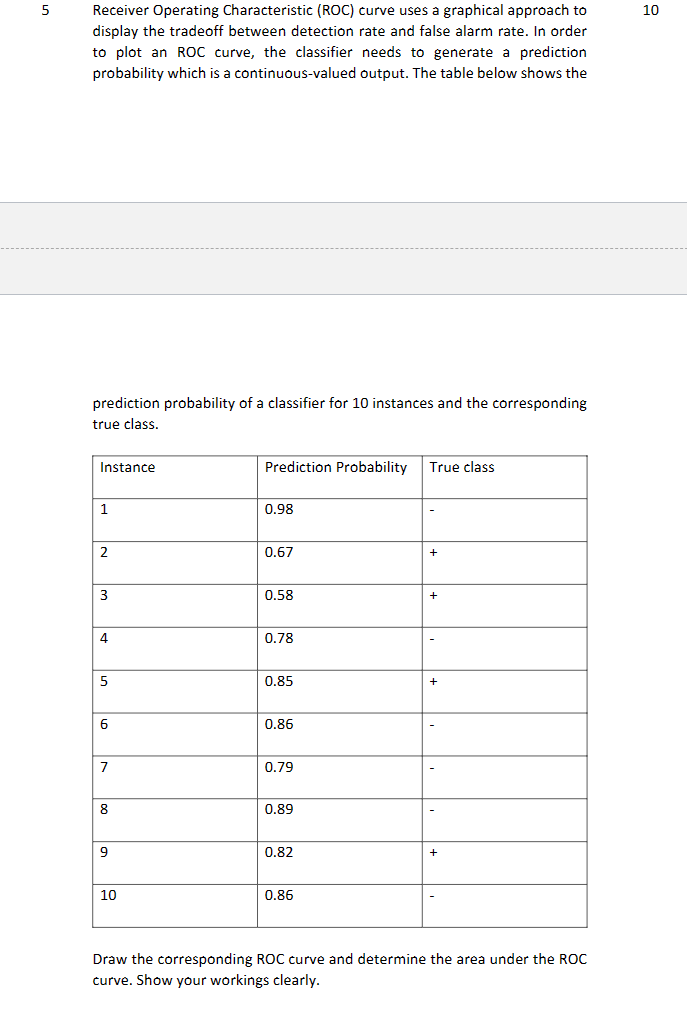
5 10 Receiver Operating Characteristic (ROC) curve uses a graphical approach to display the tradeoff between detection rate and false alarm rate. In order to plot an ROC curve, the classifier needs to generate a prediction probability which is a continuous-valued output. The table below shows the prediction probability of a classifier for 10 instances and the corresponding true class. Instance Prediction Probability True class 1 0.98 2 0.67 + 3 0.58 + 4 0.78 - 5 0.85 + 6 0.86 7 0.79 8 0.89 9 0.82 + 10 0.86 Draw the corresponding ROC curve and determine the area under the ROC curve. Show your workings clearly
Step by Step Solution
There are 3 Steps involved in it
1 Expert Approved Answer
Step: 1 Unlock

Question Has Been Solved by an Expert!
Get step-by-step solutions from verified subject matter experts
Step: 2 Unlock
Step: 3 Unlock