

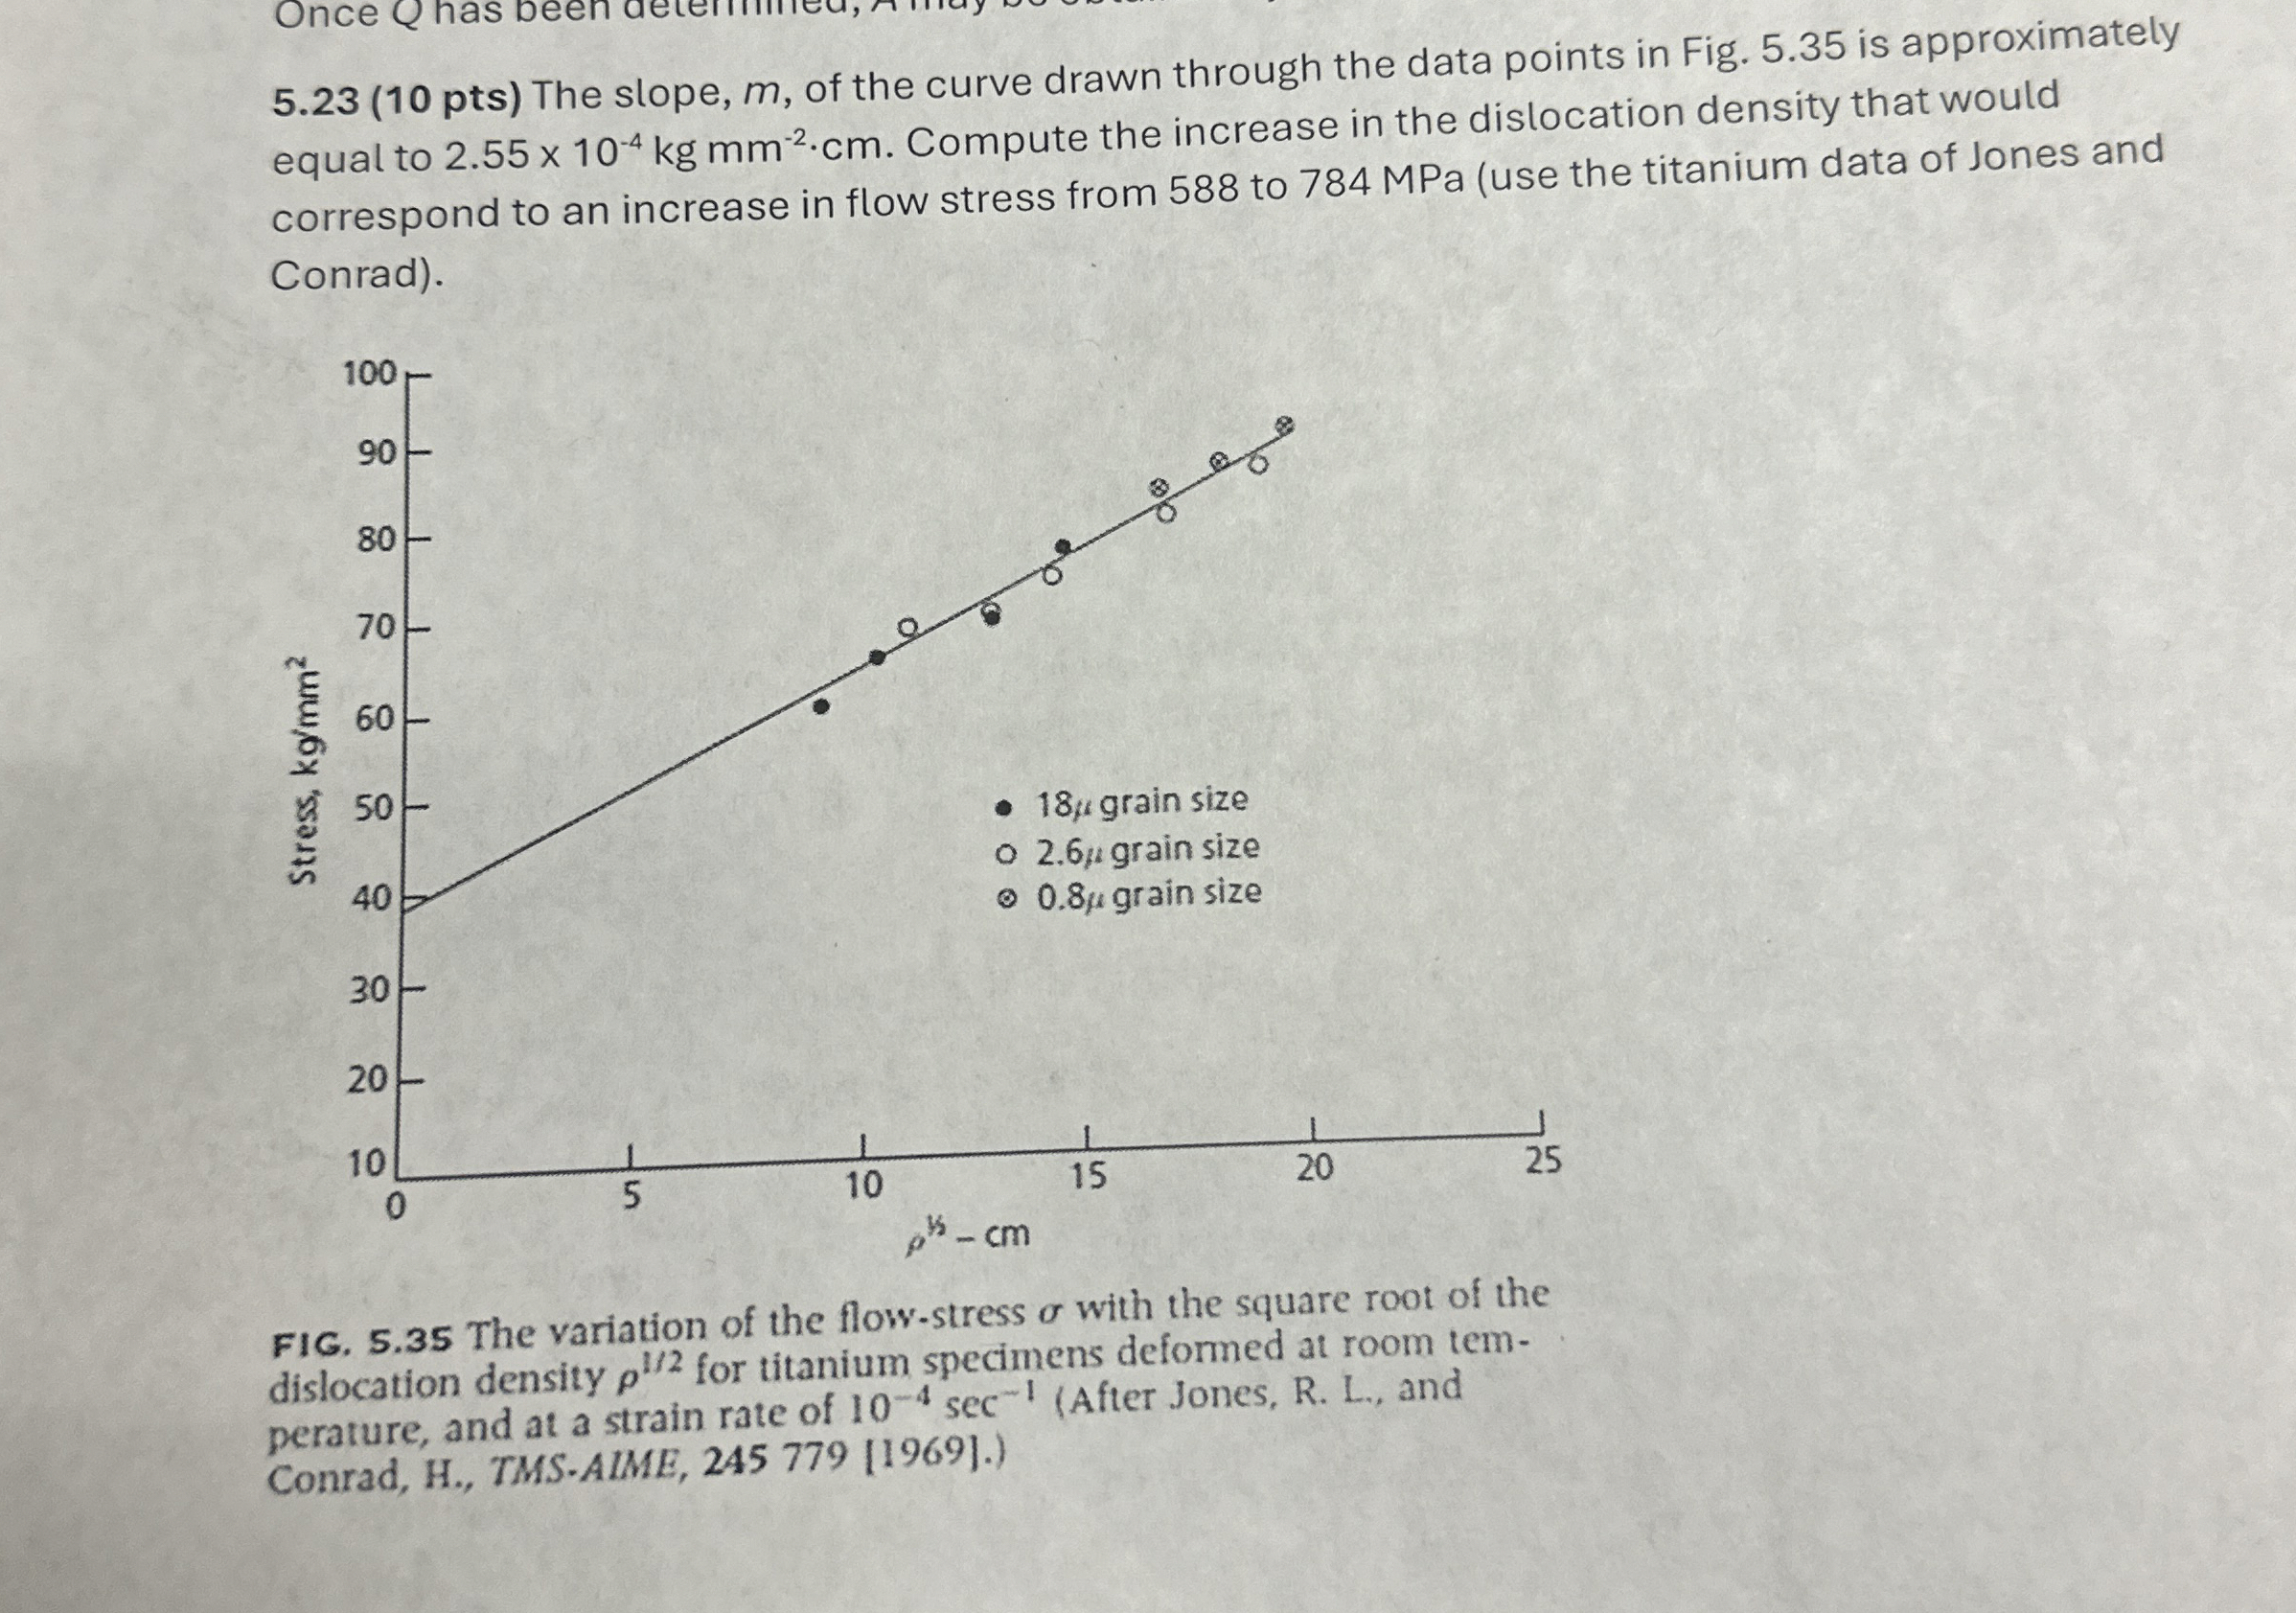
Question: 5 . 2 3 ( 1 0 pts ) The slope, m , of the curve drawn through the data points in Fig. 5 .
pts The slope, of the curve drawn through the data points in Fig. is approximately
equal to Compute the increase in the dislocation density that would
correspond to an increase in flow stress from to MPa use the titanium data of Jones and
Conrad
FIG. The variation of the flowstress with the square root of the
dislocation density for titanium specimens deformed at room tem
perature, and at a strain rate of After Jones, R L and
Conrad, H TMSALME,
Step by Step Solution
There are 3 Steps involved in it
1 Expert Approved Answer
Step: 1 Unlock

Question Has Been Solved by an Expert!
Get step-by-step solutions from verified subject matter experts
Step: 2 Unlock
Step: 3 Unlock