

Question: 5 . ( 4 0 Points ) You have been recording the concentration of a contaminant in ( mathrm { mg } /
Points You have been recording the concentration of a contaminant in mathrmmgmathrmL as it travels down a stream over the course of days. You know that the contamination plume should behave according to the following equation:
CC eCleftttright
Where C is the initial concentration, C is the decay constant of the contaminant, and t is the time at which the peak of concentration occurs. For this problem you know that the initial concentration was mathrmmgunderlineunderlineL and the peak of the concentration occurred at days. The daily observations have been provided to you in a text file format eg np loadt xt YourFileNametxt For this problem you will need to figure out the decay constant leftmathrmCright by trying different values staring from a value of all the way up to a value of ie nparange You will select the best one based on the goodness of fit metrics.
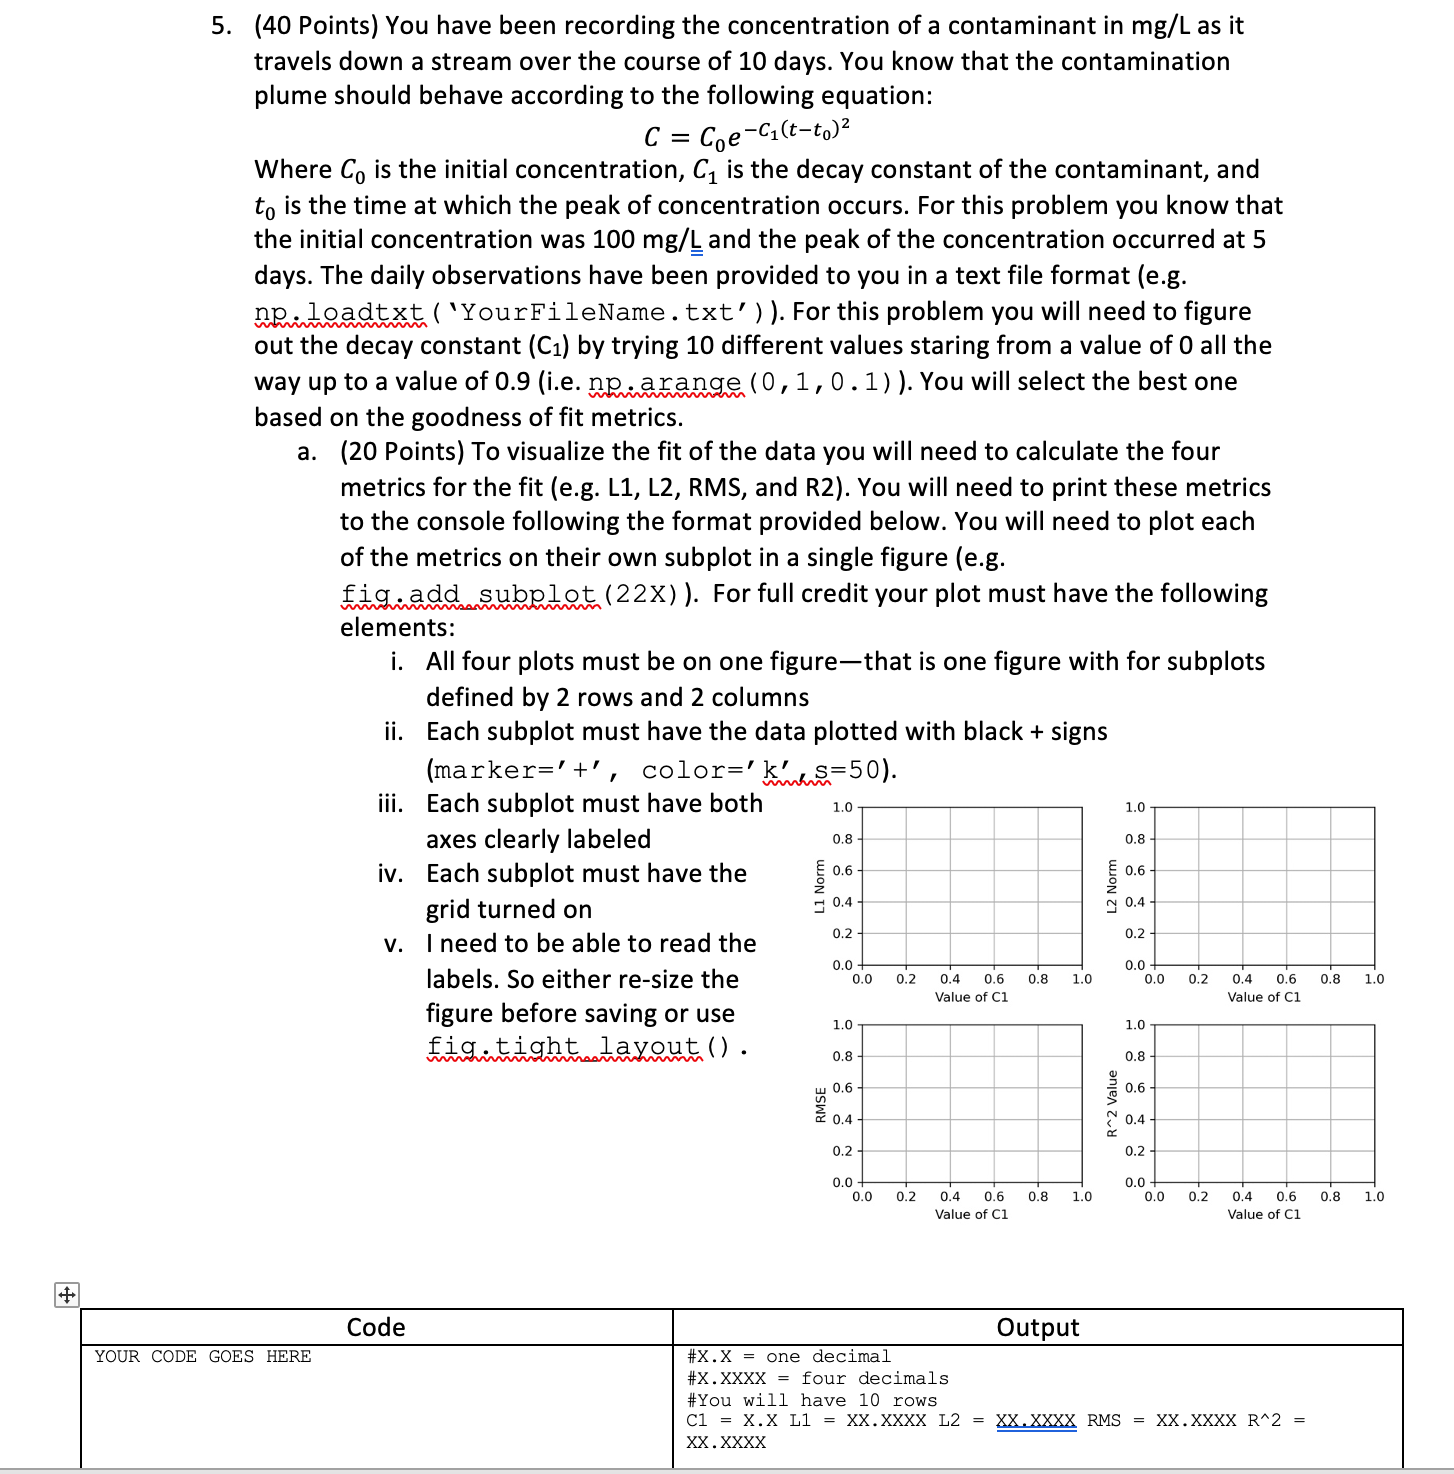
a Points To visualize the fit of the data you will need to calculate the four metrics for the fit eg L L RMS and R You will need to print these metrics to the console following the format provided below. You will need to plot each of the metrics on their own subplot in a single figure eg
fig. add subplot X For full credit your plot must have the following elements:
i All four plots must be on one figurethat is one figure with for subplots defined by rows and columns
ii Each subplot must have the data plotted with black signs marker colorks
iii. Each subplot must have both axes clearly labeled
iv Each subplot must have the grid turned on
v I need to be able to read the labels. So either resize the figure before saving or use fig.tight layout
Step by Step Solution
There are 3 Steps involved in it
1 Expert Approved Answer
Step: 1 Unlock

Question Has Been Solved by an Expert!
Get step-by-step solutions from verified subject matter experts
Step: 2 Unlock
Step: 3 Unlock