

Question: 5. [40 points] A restaurant has tracked the average frequency of tables needed for a month for lunch and dinner service. The data is as
![5. [40 points] A restaurant has tracked the average frequency of](https://dsd5zvtm8ll6.cloudfront.net/si.experts.images/questions/2024/11/673df9bd1050f_876673df9bcdc965.jpg)
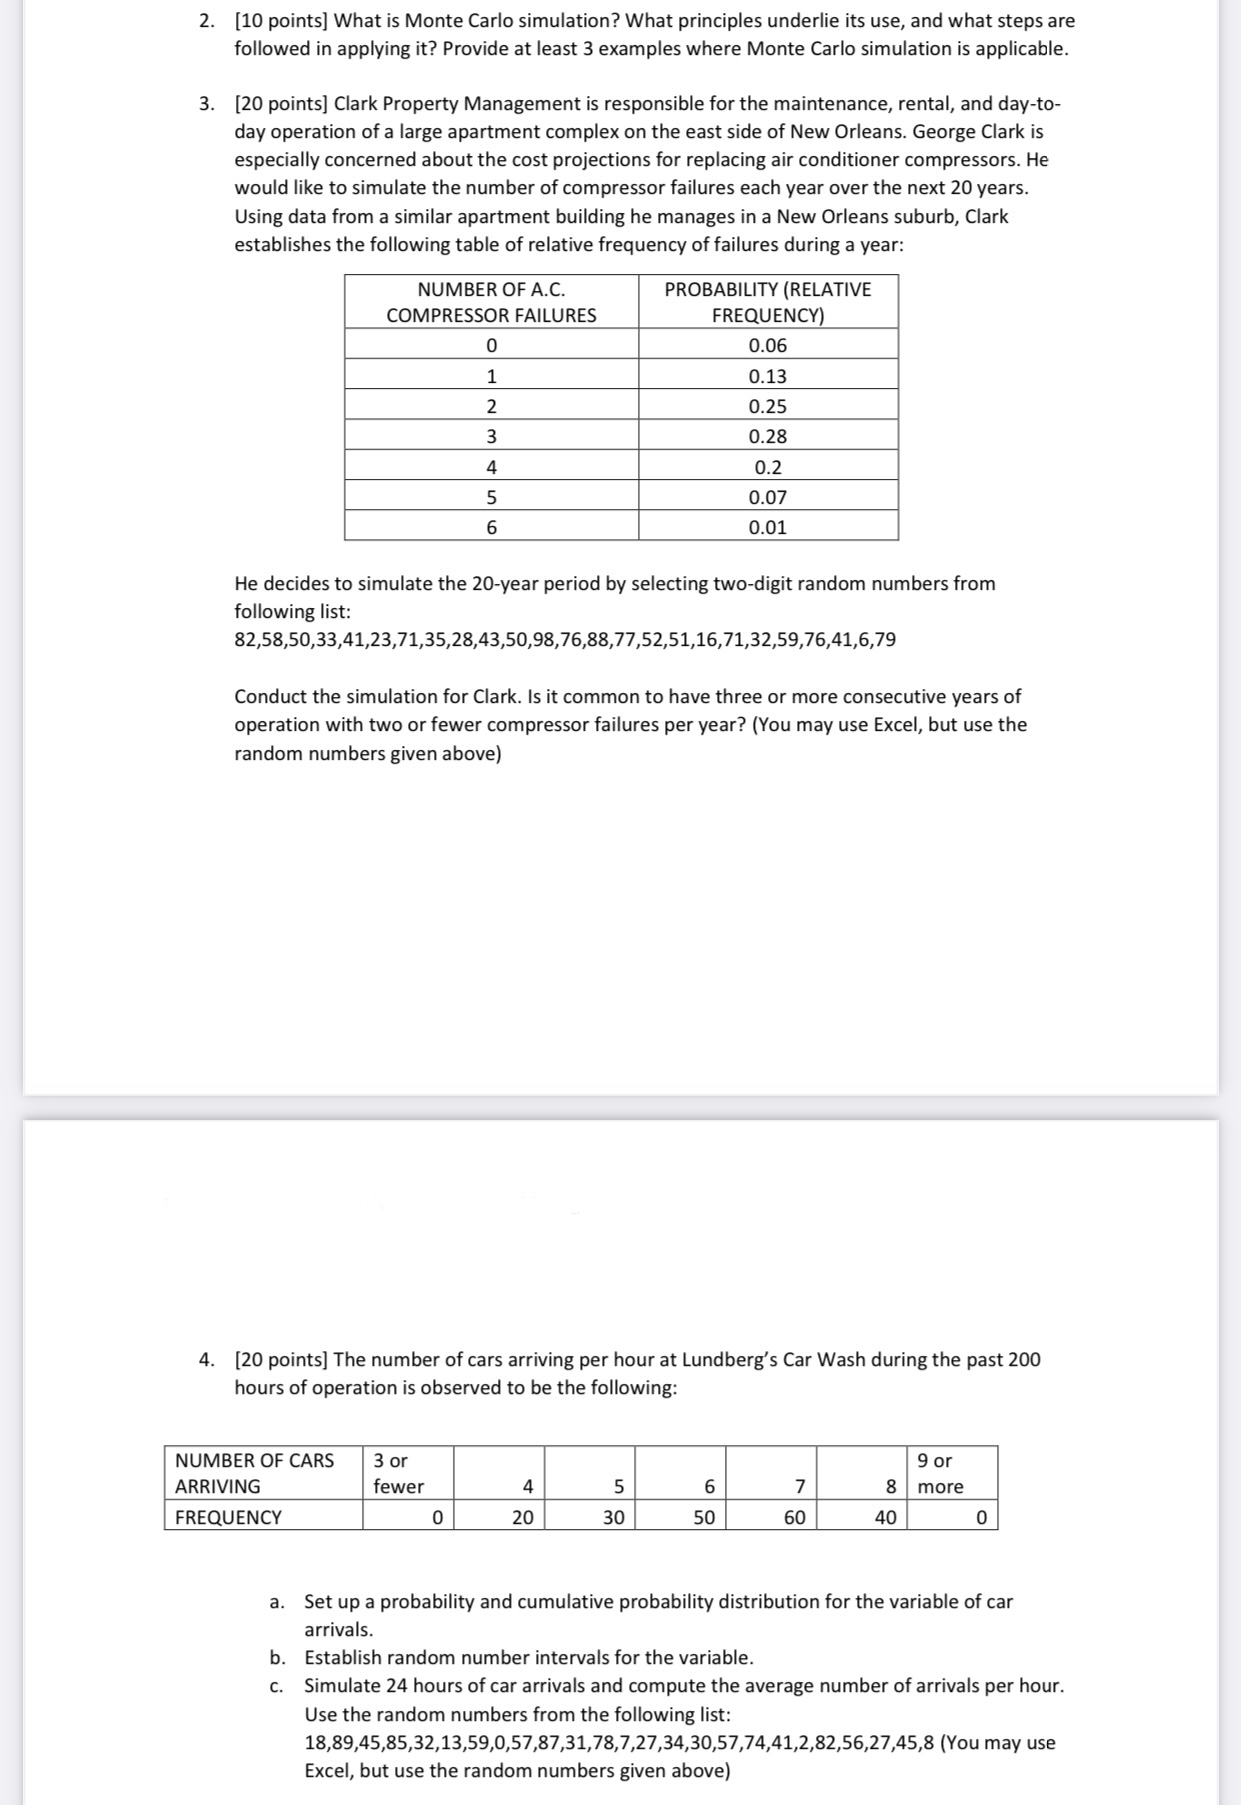
5. [40 points] A restaurant has tracked the average frequency of tables needed for a month for lunch and dinner service. The data is as follows: Tables needed Lunch Avg. Frequency Dinner Avg. Frequency A waiter can handle four tables and the restaurant needs one beverage person for each eight tables plus one busboy per twelve tables. To improve customer service the restaurant always rounds up a fractional waiter, beverage, or busboy load. The restaurant wants to simulate the number of tables needed and calculate the staffing required for waiters, busboys, and beverage servers. a. Set up a probability and cumulative probability distribution for the number of tables needed for lunch and dinner services. b. Using Excel random number generator, simulate the table requirement for 2 weeks for lunch and dinner service. Show the table requirement. c. Determine the staffing required for waiters, busboys, and beverage servers for each day for each service. Show the staffing requirement. Calculate the average staffing requirement per day for waiters, busboys, and beverage servers. d. Run the simulation for 5 replications with different random numbers. Record the average staffing requirement for each replication. Discuss the variation of staff requirement in each replication. If you were the operations manager of the restaurant, how would you use the simulation results to plan employee scheduling? 2. [10 points] What is Monte Carlo simulation? What principles underlie its use, and what steps are followed in applying it? Provide at least 3 examples where Monte Carlo simulation is applicable. 3. [20 points] Clark Property Management is responsible for the maintenance, rental, and day-to- day operation of a large apartment complex on the east side of New Orleans. George Clark is especially concerned about the cost projections for replacing air conditioner compressors. He would like to simulate the number of compressor failures each year over the next 20 years. Using data from a similar apartment building he manages in a New Orleans suburb, Clark establishes the following table of relative frequency of failures during a year: NUMBER OF AC. PROBABILITY (RELATIVE COMPRESSOR FAILURES FREQUENCY] 0.06 0.13 0.25 0.28 0.2 0.07I 0.01 He decides to simulate the 20-year period by selecting two-digit random numbers from following list: 82,58,50,33,41,23,71,35,28,43,50,98,76,88,77,52,51,16,71,32,59,76,41,6,79 Conduct the simulation for Clark. Is it common to have three or more consecutive years of operation with two or fewer compressor failures per year? (You may use Excel, but use the random numbers given above} 4. [20 points] The number of cars arriving per hour at Lundberg's Car Wash during the past 200 hours of operation is observed to be the following: NUMBER OF CARS 3 or 9 or ARRIVING fewer 4 5 6 7 8 more I FREQUENCY o 20 I 30 so so 40 o a. Set up a probability and cumulative probability distribution for the variable of car arrivals. b. Establish random number intervals for the variable. Simulate 24 hours of car arrivals and compute the average number of arrivals per hour. Use the random numbers from the following list: 18,89,45,85,32,13,59,0,57,87,31,78,7,27,34,30,57,74,41,2,82,56,27,45,8 [You may use Excel, but use the random numbers given above}
Step by Step Solution
There are 3 Steps involved in it

Get step-by-step solutions from verified subject matter experts