

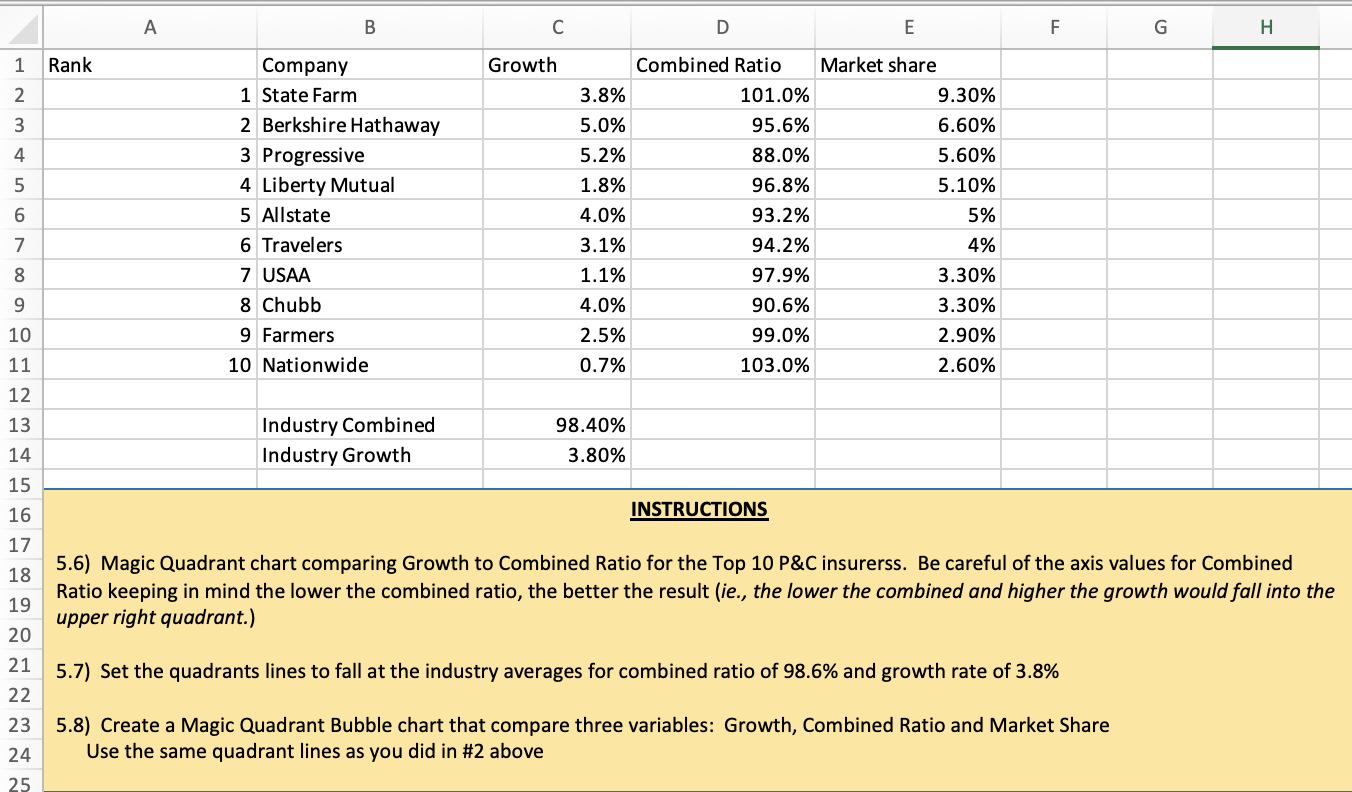
Question: 5 . 6 ) Magic Quadrant chart comparing Growth to Combined Ratio for the Top 1 0 P &C insurerss. Be careful of the
Magic Quadrant chart comparing Growth to Combined Ratio for the Top P&C insurerss. Be careful of the axis values for Combined Ratio keeping in mind the lower the combined ratio, the better the result ie the lower the combined and higher the growth would fall into the upper right quadrant. Set the quadrants lines to fall at the industry averages for combined ratio of and growth rate of Create a Magic Quadrant Bubble chart that compare three variables: Growth, Combined Ratio and Market Share Use the same quadrant lines as you did in # above
Step by Step Solution
There are 3 Steps involved in it
1 Expert Approved Answer
Step: 1 Unlock

Question Has Been Solved by an Expert!
Get step-by-step solutions from verified subject matter experts
Step: 2 Unlock
Step: 3 Unlock