

Question: 5 7 8 59 70 71 72 73 74 %% 5. Plot the surface z = sin(sqrt(x^2+y^2)+3) for x in (-8,8], y. in (-8, 8]
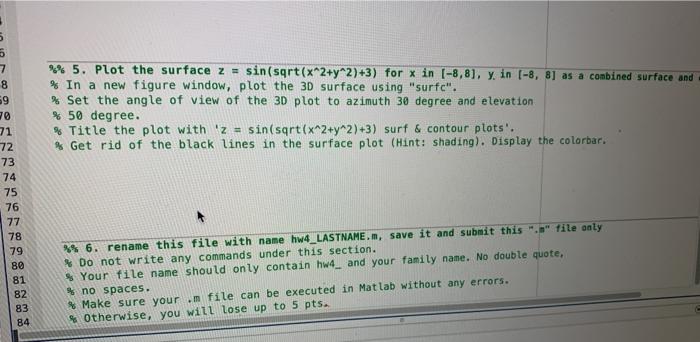
5 7 8 59 70 71 72 73 74 %% 5. Plot the surface z = sin(sqrt(x^2+y^2)+3) for x in (-8,8], y. in (-8, 8] as a combined surface and % In a new figure window, plot the 3D surface using "surfc". % Set the angle of view of the 3D plot to azimuth 30 degree and elevation % 50 degree. % Title the plot with 'z = sin(sqrt(x^2+y^2)+3) surf & contour plots'. % Get rid of the black lines in the surface plot (Hint: shading). Display the colorbar. 76 77 78 80 81 82 83 84 ** 6. rename this file with name hw4_LASTNAME.m, save it and submit this .." file anty Do not write any commands under this section. Your file name should only contain hw4_ and your family name. No double quote, % no spaces. Make sure your file can be executed in Matlab without any errors. % Otherwise, you will lose up to 5 pts
Step by Step Solution
There are 3 Steps involved in it

Get step-by-step solutions from verified subject matter experts