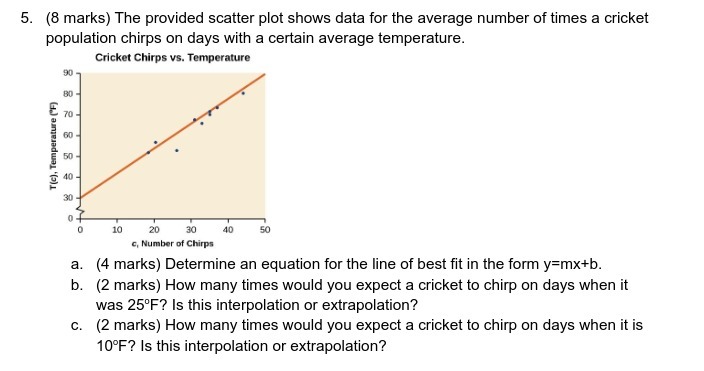
Question: 5. (8 marks) The provided scatter plot shows data for the average number of times a cricket population chirps on days with a certain average

5. (8 marks) The provided scatter plot shows data
5. (8 marks) The provided scatter plot shows data for the average number of times a cricket population chirps on days with a certain average temperature. Cricket Chirps vs. Temperature 90 70- 60 T(c), Temperature ['F] 50 40 - 30 of 0 10 20 30 40 50 c, Number of Chirps a. (4 marks) Determine an equation for the line of best fit in the form y=mx+b. b. (2 marks) How many times would you expect a cricket to chirp on days when it was 25'F? Is this interpolation or extrapolation? c. (2 marks) How many times would you expect a cricket to chirp on days when it is 10 F? Is this interpolation or extrapolation

Step by Step Solution

There are 3 Steps involved in it

1 Expert Approved Answer
Step: 1 Unlock blur-text-image
Question Has Been Solved by an Expert!

Get step-by-step solutions from verified subject matter experts

Step: 2 Unlock
Step: 3 Unlock

Students Have Also Explored These Related Mathematics Questions!