

Question: = 5. A random variable is normally distributed with a mean of = 50 and a standard deviation of a. Which of the following
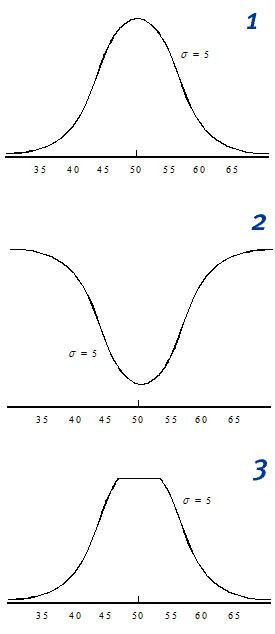
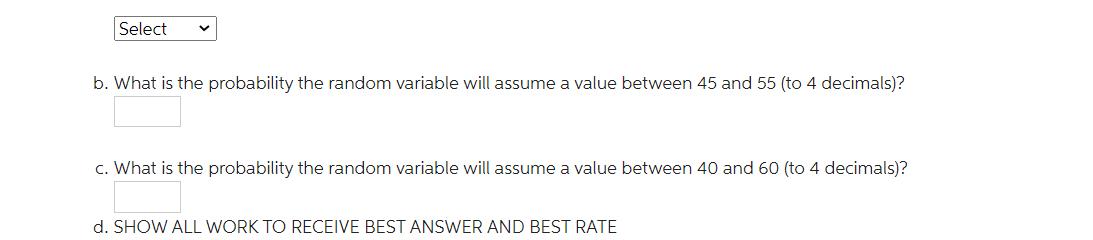
= 5. A random variable is normally distributed with a mean of = 50 and a standard deviation of a. Which of the following graphs accurately represents the probability density function? 0=5 A 35 40 45 50 55 60 65 35 0 = 5 40 45 50 55 60 65 35 40 45 0 = 5 50 55 60 65 1 2 3 Select V b. What is the probability the random variable will assume a value between 45 and 55 (to 4 decimals)? c. What is the probability the random variable will assume a value between 40 and 60 (to 4 decimals)? d. SHOW ALL WORK TO RECEIVE BEST ANSWER AND BEST RATE
Step by Step Solution
★★★★★
3.42 Rating (142 Votes )
There are 3 Steps involved in it
1 Expert Approved Answer
Step: 1 Unlock

Question Has Been Solved by an Expert!
Get step-by-step solutions from verified subject matter experts
Step: 2 Unlock
Step: 3 Unlock