

Question: 5. A. See picture belowSelect the correct histogram from the above dataHistogram AHistogram BHistogram CB . which is the following is true:The distribution is symmetricThe
5. A. See picture belowSelect the correct histogram from the above dataHistogram AHistogram BHistogram CB . which is the following is true:The distribution is symmetricThe distribution is skewed to the leftThe distribution is skewed to the rightC. Identify any unusual values (round your answers to 2 decimal placesUnusual values________ million_________million
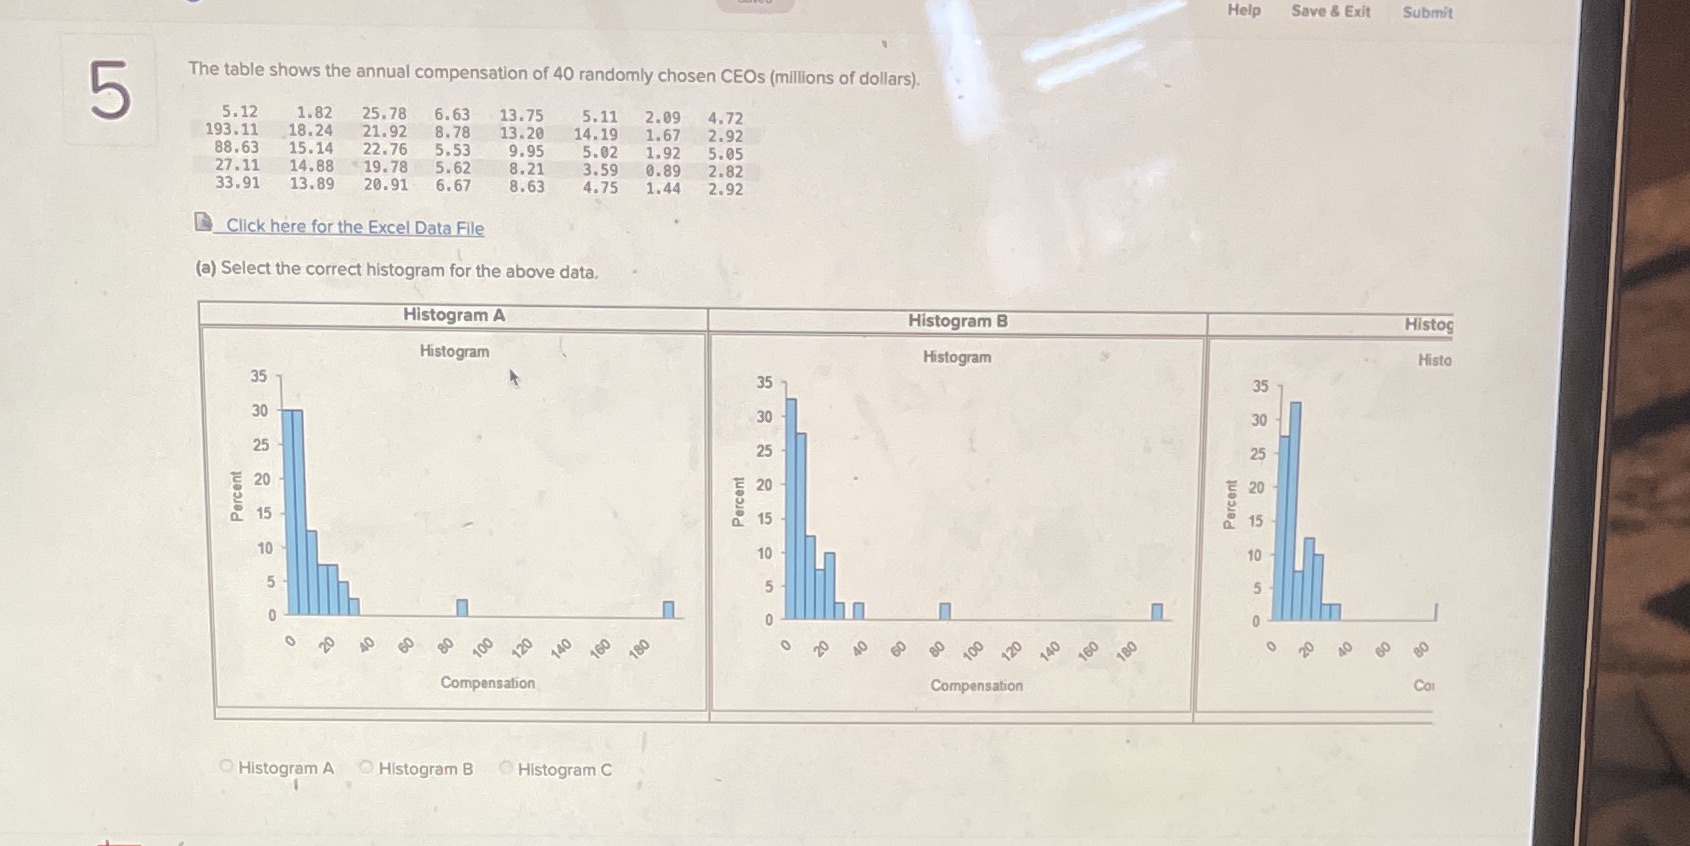
Help Save & Exit Submit 5 The table shows the annual compensation of 40 randomly chosen CEOs (millions of dollars). 5. 12 1.82 25.78 6.63 13.75 5.11 2.09 4.72 193.11 18.24 21.92 8. 78 13.20 14. 19 1.67 2.92 88.63 15. 14 22.76 5.53 9.95 5.02 1.92 5.05 27.11 14. 88 19. 78 5.62 8.21 3.59 0.89 2.82 33.91 13.89 20.91 6,67 8.63 4.75 1.44 2.92 Click here for the Excel Data File (a) Select the correct histogram for the above data. Histogram A Histogram B Histog Histogram Histogram Histo 35 35 35 30 30 25 Percent Percent Percent 15 un O Compensation Compensation Histogram A Histogram B Histogram C
Step by Step Solution
There are 3 Steps involved in it

Get step-by-step solutions from verified subject matter experts