

Question: 5. Abbey Taylor, CFA, has been directed to determine the value of Sundanci's stock using the FCFF valuation model. Taylor believes that Sundanci's FCFF will
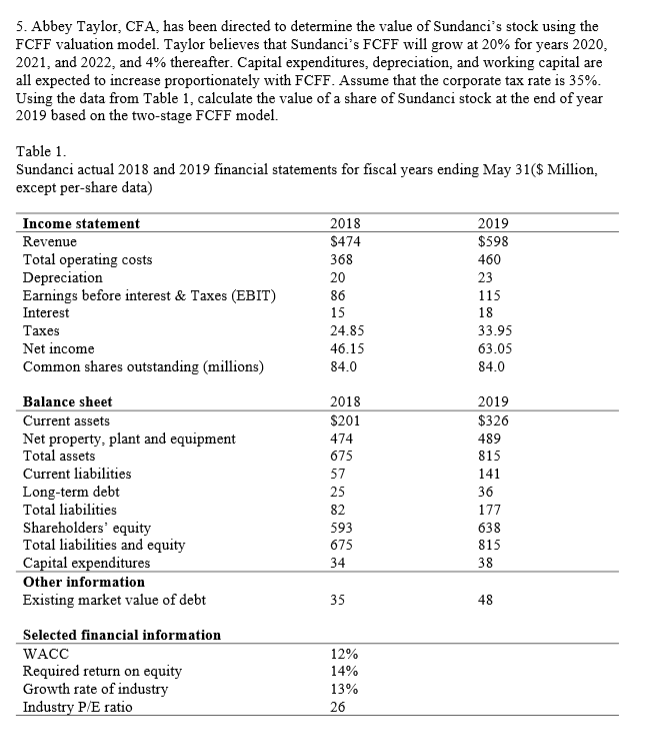
5. Abbey Taylor, CFA, has been directed to determine the value of Sundanci's stock using the FCFF valuation model. Taylor believes that Sundanci's FCFF will grow at 20% for years 2020, 2021, and 2022, and 4% thereafter. Capital expenditures, depreciation, and working capital are all expected to increase proportionately with FCFF. Assume that the corporate tax rate is 35%. Using the data from Table 1, calculate the value of a share of Sundanci stock at the end of year 2019 based on the two-stage FCFF model. Table 1. Sundanci actual 2018 and 2019 financial statements for fiscal years ending May 31($ Million, except per-share data) 2018 $474 368 2019 $598 460 23 Income statement Revenue Total operating costs Depreciation Earnings before interest & Taxes (EBIT) Interest Taxes Net income Common shares outstanding (millions) 86 15 24.85 46.15 84.0 115 18 33.95 63.05 84.0 2018 $201 474 675 2019 $326 489 815 141 Balance sheet Current assets Net property, plant and equipment Total assets Current liabilities Long-term debt Total liabilities Shareholders' equity Total liabilities and equity Capital expenditures Other information Existing market value of debt 638 815 675 34 Selected financial information WACC Required return on equity Growth rate of industry Industry P/E ratio 12% 14% 13% 5. Abbey Taylor, CFA, has been directed to determine the value of Sundanci's stock using the FCFF valuation model. Taylor believes that Sundanci's FCFF will grow at 20% for years 2020, 2021, and 2022, and 4% thereafter. Capital expenditures, depreciation, and working capital are all expected to increase proportionately with FCFF. Assume that the corporate tax rate is 35%. Using the data from Table 1, calculate the value of a share of Sundanci stock at the end of year 2019 based on the two-stage FCFF model. Table 1. Sundanci actual 2018 and 2019 financial statements for fiscal years ending May 31($ Million, except per-share data) 2018 $474 368 2019 $598 460 23 Income statement Revenue Total operating costs Depreciation Earnings before interest & Taxes (EBIT) Interest Taxes Net income Common shares outstanding (millions) 86 15 24.85 46.15 84.0 115 18 33.95 63.05 84.0 2018 $201 474 675 2019 $326 489 815 141 Balance sheet Current assets Net property, plant and equipment Total assets Current liabilities Long-term debt Total liabilities Shareholders' equity Total liabilities and equity Capital expenditures Other information Existing market value of debt 638 815 675 34 Selected financial information WACC Required return on equity Growth rate of industry Industry P/E ratio 12% 14% 13%
Step by Step Solution
There are 3 Steps involved in it

Get step-by-step solutions from verified subject matter experts