

Question: 5. At a hydrocarbon processing factory, process control involves periodic analysis of samples for a certain process quality parameter. The analytic procedure currently used is
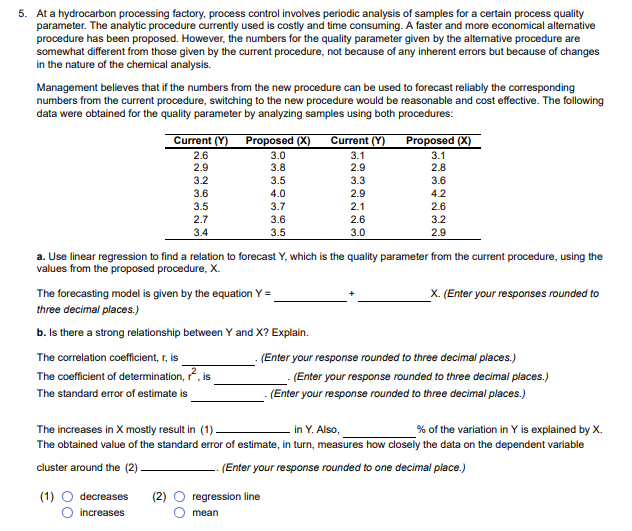
5. At a hydrocarbon processing factory, process control involves periodic analysis of samples for a certain process quality parameter. The analytic procedure currently used is costly and time consuming. A faster and more economical altemative procedure has been proposed. However, the numbers for the quality parameter given by the alternative procedure are somewhat different from those given by the current procedure, not because of any inherent errors but because of changes in the nature of the chemical analysis. Management believes that if the numbers from the new procedure can be used to forecast reliably the corresponding numbers from the current procedure, switching to the new procedure would be reasonable and cost effective. The following data were obtained for the quality parameter by analyzing samples using both procedures: Current (Y) Proposed (X() Current (Y) Proposed (X) 2.6 3.0 3.1 3.1 2.9 3.8 2.9 2.8 3.2 3.5 3.3 3.6 3.6 4.0 2.9 4.2 3.5 3.7 2.1 2.6 2.7 3.6 2.6 3.2 34 3.5 3.0 2.9 a. Use linear regression to find a relation to forecast Y, which is the quality parameter from the current procedure, using the values from the proposed procedure, X. The forecasting model is given by the equation Y = X. (Enter your responses rounded to three decimal places.) b. Is there a strong relationship between Y and X? Explain. The correlation coefficient, r, is (Enter your response rounded to three decimal places.) The coefficient of determination, r , is . (Enter your response rounded to three decimal places.) The standard error of estimate is (Enter your response rounded to three decimal places.) The increases in X mostly result in (1) in Y. Also, % of the variation in Y is explained by X. The obtained value of the standard error of estimate, in turn, measures how closely the data on the dependent variable cluster around the (2) (Enter your response rounded to one decimal place.) (1) O decreases (2) O regression line O increases O mean
Step by Step Solution
There are 3 Steps involved in it

Get step-by-step solutions from verified subject matter experts