

Question: 5. Calculate planning materiality in a dollar ($) amount. You must include a breakdown of your calculation and a justification of your choice of base,
5. Calculate planning materiality in a dollar ($) amount. You must include a breakdown of your calculation and a justification of your choice of base, the percentage used and your assessment of detection risk. Assume the company's control risk is high.
6. Determine a number of methods the company can implement to overcome the high control risk. Assume the company's control risk is high.
Link to 2020 financial reports:
https://investor.myer.com.au/Reports/?page=Annual-Reports
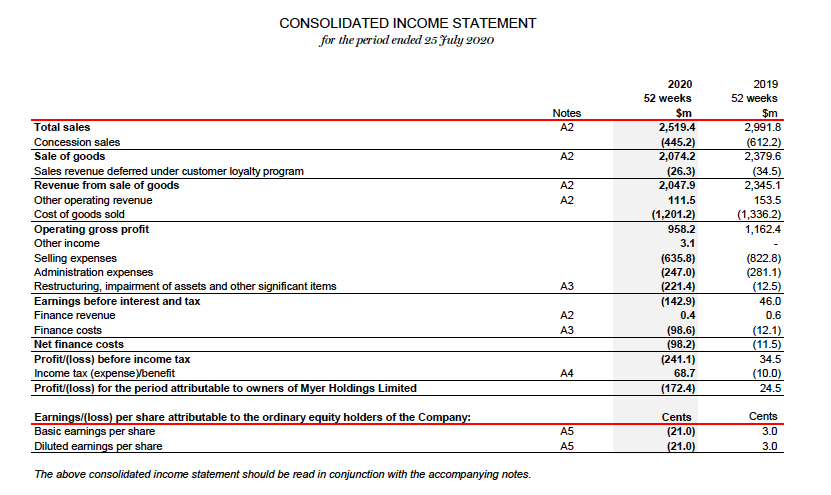
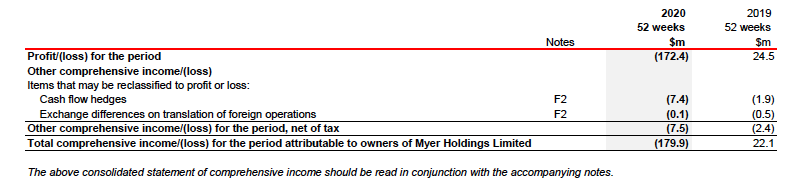
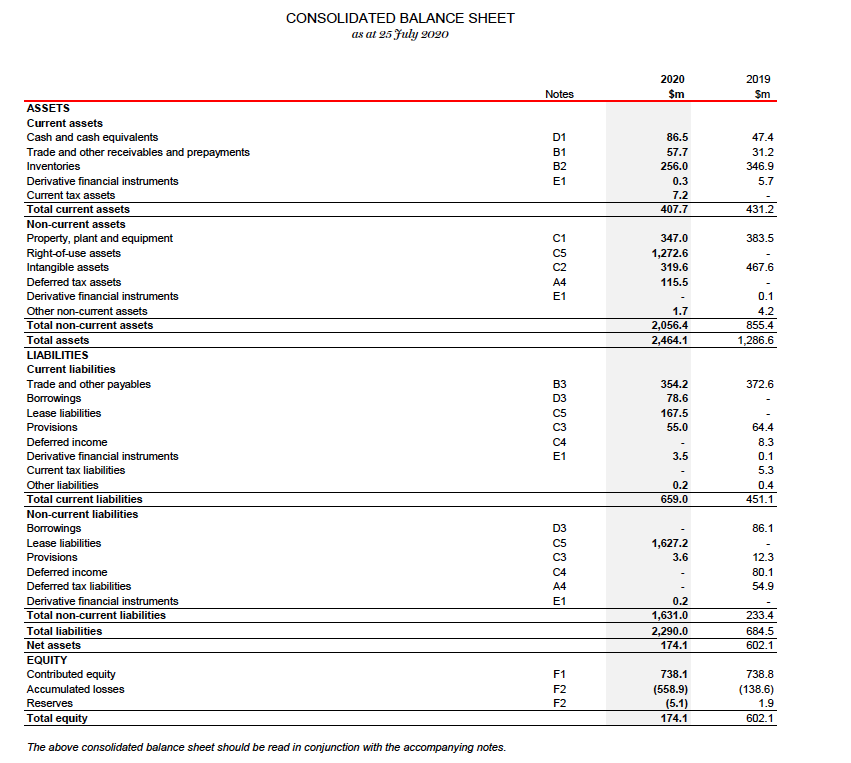
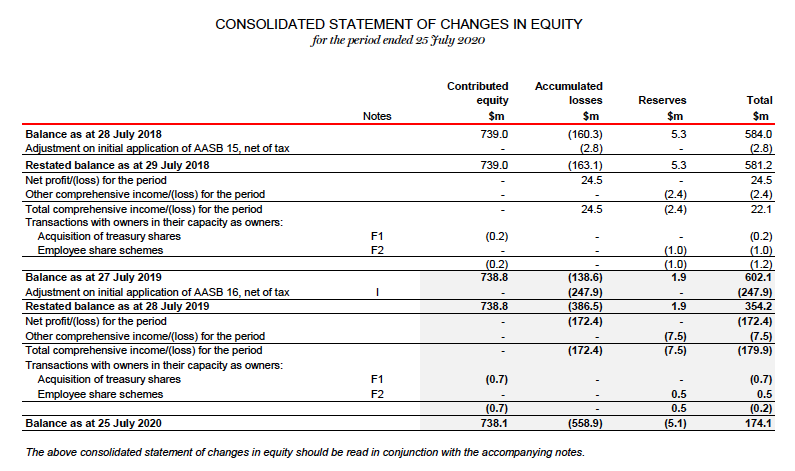
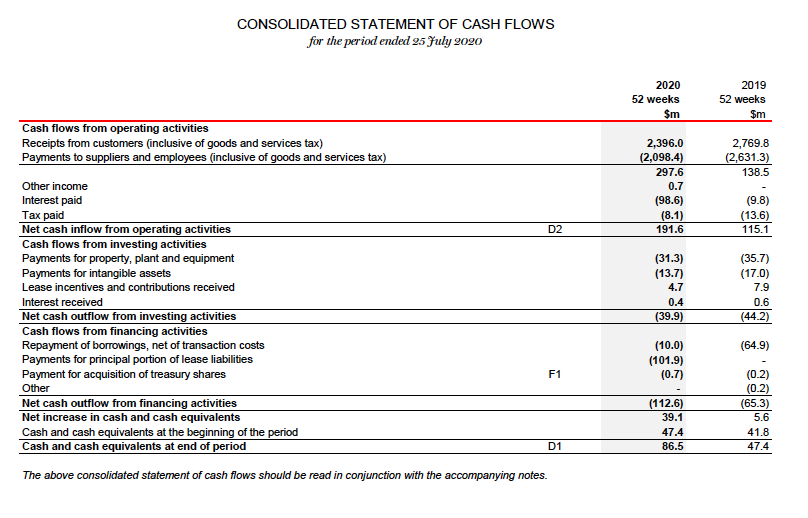
CONSOLIDATED INCOME STATEMENT for the period ended 25 July 2020 2020 2019 52 weeks 52 weeks Notes $m Total sales A2 2,519.4 2,991.8 Concession sales (445.2) (612.2) Sale of goods A2 2,074.2 2,379.6 Sales revenue deferred under customer loyalty program (26.3) (34.5) Revenue from sale of goods A2 2,047.9 2,345.1 Other operating revenue A2 111.5 153.5 Cost of goods sold (1,201.2) (1,336.2) Operating gross profit 958.2 1,162.4 Other income 3.1 Selling expenses (635.8) (822.8) Administration expenses (247.0) (281.1) Restructuring, impairment of assets and other significant items A3 (221.4) (12.5) Earnings before interest and tax (142.9) 46.0 Finance revenue A2 0.4 0.6 Finance costs A3 (98.6) (12.1) Net finance costs (98.2) (11.5) Profit/(loss) before income tax (241.1) 34.5 Income tax (expense)benefit A4 68.7 (10.0) Profit/(loss) for the period attributable to owners of Myer Holdings Limited (172.4) 24.5 Earnings/(loss) per share attributable to the ordinary equity holders of the Company: Cents Cents Basic earnings per share A5 (21.0) 3.0 Diluted earnings per share A5 (21.0) 3.0 The above consolidated income statement should be read in conjunction with the accompanying notes.2020 2019 52 weeks 52 weeks Notes $m Profit/ (loss) for the period (172.4) 24.5 Other comprehensive income/(loss) Items that may be reclassified to profit or loss: Cash flow hedges F2 (7.4) (1.9) Exchange differences on translation of foreign operations F2 (0.1) (0.5) Other comprehensive income/(loss) for the period, net of tax (7.5) (2.4) Total comprehensive income/(loss) for the period attributable to owners of Myer Holdings Limited (179.9) 22.1 The above consolidated statement of comprehensive income should be read in conjunction with the accompanying notes.CONSOLIDATED BALANCE SHEET as at 25 July 2090 2020 2019 Notes $m $m ASSETS Current assets Cash and cash equivalents 86.5 47.4 Trade and other receivables and prepayments 57.7 31.2 Inventories 256.0 346.9 Derivative financial instruments 0.3 57 Current tax assets 7.2 Total current assets 407.7 431.2 Non-current assets Property, plant and equipment 347.0 383.5 Right-of-use assets 1,272.6 Intangible assets 319.6 467.6 Deferred tax assets 115.5 Derivative financial instruments 0.1 Other non-current assets 1.7 4.2 Total non-current assets 2,056.4 55.4 Total assets 2,464.1 1,286.6 LIABILITIES Current liabilities Trade and other payables 354.2 372.6 Borrowings 78.6 Lease liabilities 167.5 Provisions 55.0 64.4 Deferred income 8.3 Derivative financial instruments 3.5 0.1 Current tax liabilities 5.3 Other liabilities 0 4 Total current liabilities 659.0 151.1 Non-current liabilities Borrowings 86 1 Lease liabilities 1,627.2 Provisions 3.6 12.3 Deferred income 80.1 Deferred tax liabilities 54.9 Derivative financial instruments 0.2 Total non-current liabilities 1,631.0 233.4 Total liabilities 2,290.0 684.5 Net assets 174.1 602.1 EQUITY Contributed equity 738.1 738.8 Accumulated losses (558.9) (138.6) Reserves (5.1) 1.9 Total equity 174.1 602.1 The above consolidated balance sheet should be read in conjunction with the accompanying notes.CONSOLIDATED STATEMENT OF CHANGES IN EQUITY for the period ended 25 July 2020 Contributed Accumulated equity losses Reserves Total Notes $m $m $m $m Balance as at 28 July 2018 739.0 (160.3) 5.3 584.0 Adjustment on initial application of AASB 15, net of tax (2.8) (2.8) Restated balance as at 29 July 2018 739.0 (163.1) 5.3 581.2 Net profit/(loss) for the period 24.5 24.5 Other comprehensive income/(loss) for the period (2.4) (2.4) Total comprehensive income/(loss) for the period 24.5 (2.4) 22.1 Transactions with owners in their capacity as owners: Acquisition of treasury shares F1 (0.2) (0.2) Employee share schemes (1.0) (1.0) (0.2) (1.0) (1.2) Balance as at 27 July 2019 738.8 (138.6) 1.9 602.1 Adjustment on initial application of AASB 16, net of tax (247.9) (247.9) Restated balance as at 28 July 2019 738.8 386.5) 1.9 354.2 Net profit/(loss) for the period (172.4) (172.4) Other comprehensive income/(loss) for the period (7.5) (7.5) Total comprehensive income (loss) for the period (172.4) (7.5) (179.9) Transactions with owners in their capacity as owners: Acquisition of treasury shares F1 (0.7) (0.7) Employee share schemes F2 0.5 0.5 (0.7) 0.5 (0.2) Balance as at 25 July 2020 738.1 (558.9) (5.1) 174.1 The above consolidated statement of changes in equity should be read in conjunction with the accompanying notes.CONSOLIDATED STATEMENT OF CASH FLOWS for the period ended 25 July 2020 2020 2019 52 weeks 52 weeks $m $m Cash flows from operating activities Receipts from customers (inclusive of goods and services tax) 2,396.0 2,769.8 Payments to suppliers and employees (inclusive of goods and services tax) (2,098.4) (2,631.3) 297.6 138.5 Other income 0.7 Interest paid (98.6) (9.8) Tax paid (8.1) (13.6) Net cash inflow from operating activities D2 191.6 115.1 Cash flows from investing activities Payments for property, plant and equipment (31.3) (35.7) Payments for intangible assets (13.7) (17.0) Lease incentives and contributions received 4.7 7.9 Interest received 0.4 0.6 Net cash outflow from investing activities (39.9) (44.2) Cash flows from financing activities Repayment of borrowings, net of transaction costs (10.0) (64.9) Payments for principal portion of lease liabilities (101.9) Payment for acquisition of treasury shares F1 (0.7) (0.2) Other (0.2) Net cash outflow from financing activities (112.6) (65.3) Net increase in cash and cash equivalents 39.1 5.6 Cash and cash equivalents at the beginning of the period 47.4 41.8 Cash and cash equivalents at end of period D1 36.5 47.4 The above consolidated statement of cash flows should be read in conjunction with the accompanying notes
Step by Step Solution
There are 3 Steps involved in it

Get step-by-step solutions from verified subject matter experts