

Question: 5. Consider the baxplots below, labeled A, B, C, and D. Suppose they represent grades for 4 different Professors in the same class. Assume the
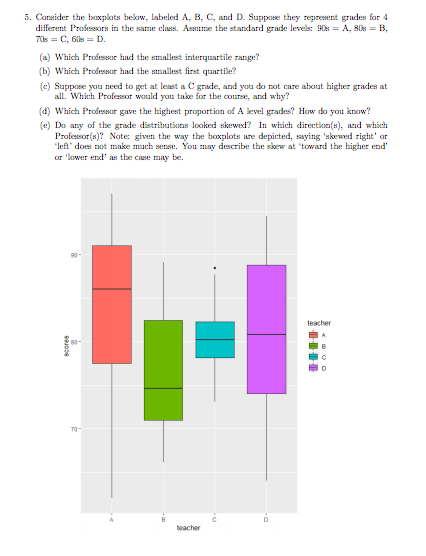
5. Consider the baxplots below, labeled A, B, C, and D. Suppose they represent grades for 4 different Professors in the same class. Assume the standard grade levels 90s = A, 80s= B. 70s = C, 6s = D. (a) Which Professor had the smallest interquartile range? (b) Which Professor had the smallest first quartile? (c) Suppose you need to get at least a C grade, and you do not care about higher grades at all. Which Professor would you take for the course, and why? (d) Which Professor gave the highest proportion of A level grades? How do you know? (e) Do any of the grade distributions looked skewed? In which direction(s), and which Professor(s)? Note: given the way the boxplots are depicted, saying 'skewed right or "left does not make much nenne. You may describe the show at toward the higher end or lower end the case may be. TU 5. Consider the baxplots below, labeled A, B, C, and D. Suppose they represent grades for 4 different Professors in the same class. Assume the standard grade levels 90s = A, 80s= B. 70s = C, 6s = D. (a) Which Professor had the smallest interquartile range? (b) Which Professor had the smallest first quartile? (c) Suppose you need to get at least a C grade, and you do not care about higher grades at all. Which Professor would you take for the course, and why? (d) Which Professor gave the highest proportion of A level grades? How do you know? (e) Do any of the grade distributions looked skewed? In which direction(s), and which Professor(s)? Note: given the way the boxplots are depicted, saying 'skewed right or "left does not make much nenne. You may describe the show at toward the higher end or lower end the case may be. TU
Step by Step Solution
There are 3 Steps involved in it

Get step-by-step solutions from verified subject matter experts