

Question: 5. Consider the following PES chart for Element M 347 37.1 29.1 3.93 238 0.42 LI 347 345 37 35 33 31 29 lonization Energy
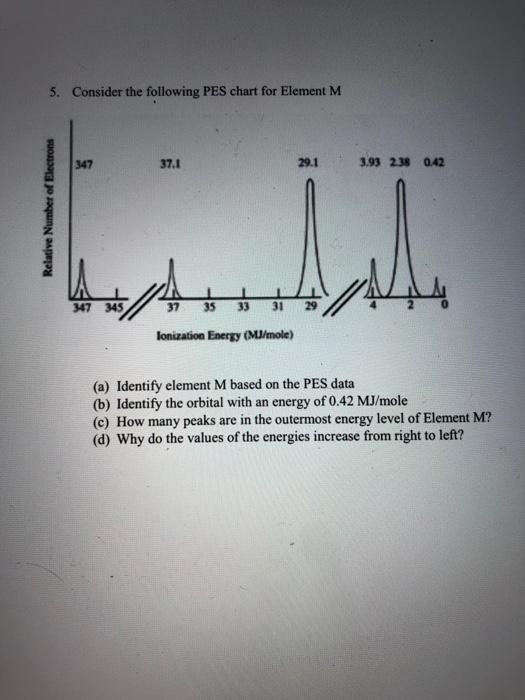
5. Consider the following PES chart for Element M 347 37.1 29.1 3.93 238 0.42 LI 347 345 37 35 33 31 29 lonization Energy (MJ/mole) (a) Identify element M based on the PES data (b) Identify the orbital with an energy of 0.42 MJ/mole (c) How many peaks are in the outermost energy level of Element M? (d) Why do the values of the energies increase from right to left
Step by Step Solution
There are 3 Steps involved in it
1 Expert Approved Answer
Step: 1 Unlock

Question Has Been Solved by an Expert!
Get step-by-step solutions from verified subject matter experts
Step: 2 Unlock
Step: 3 Unlock