

Question: 5. Consider the HSB data set and do the followings: (a) Compare the correlation between WRTG and MATH for males and females. (b) Draw scatter
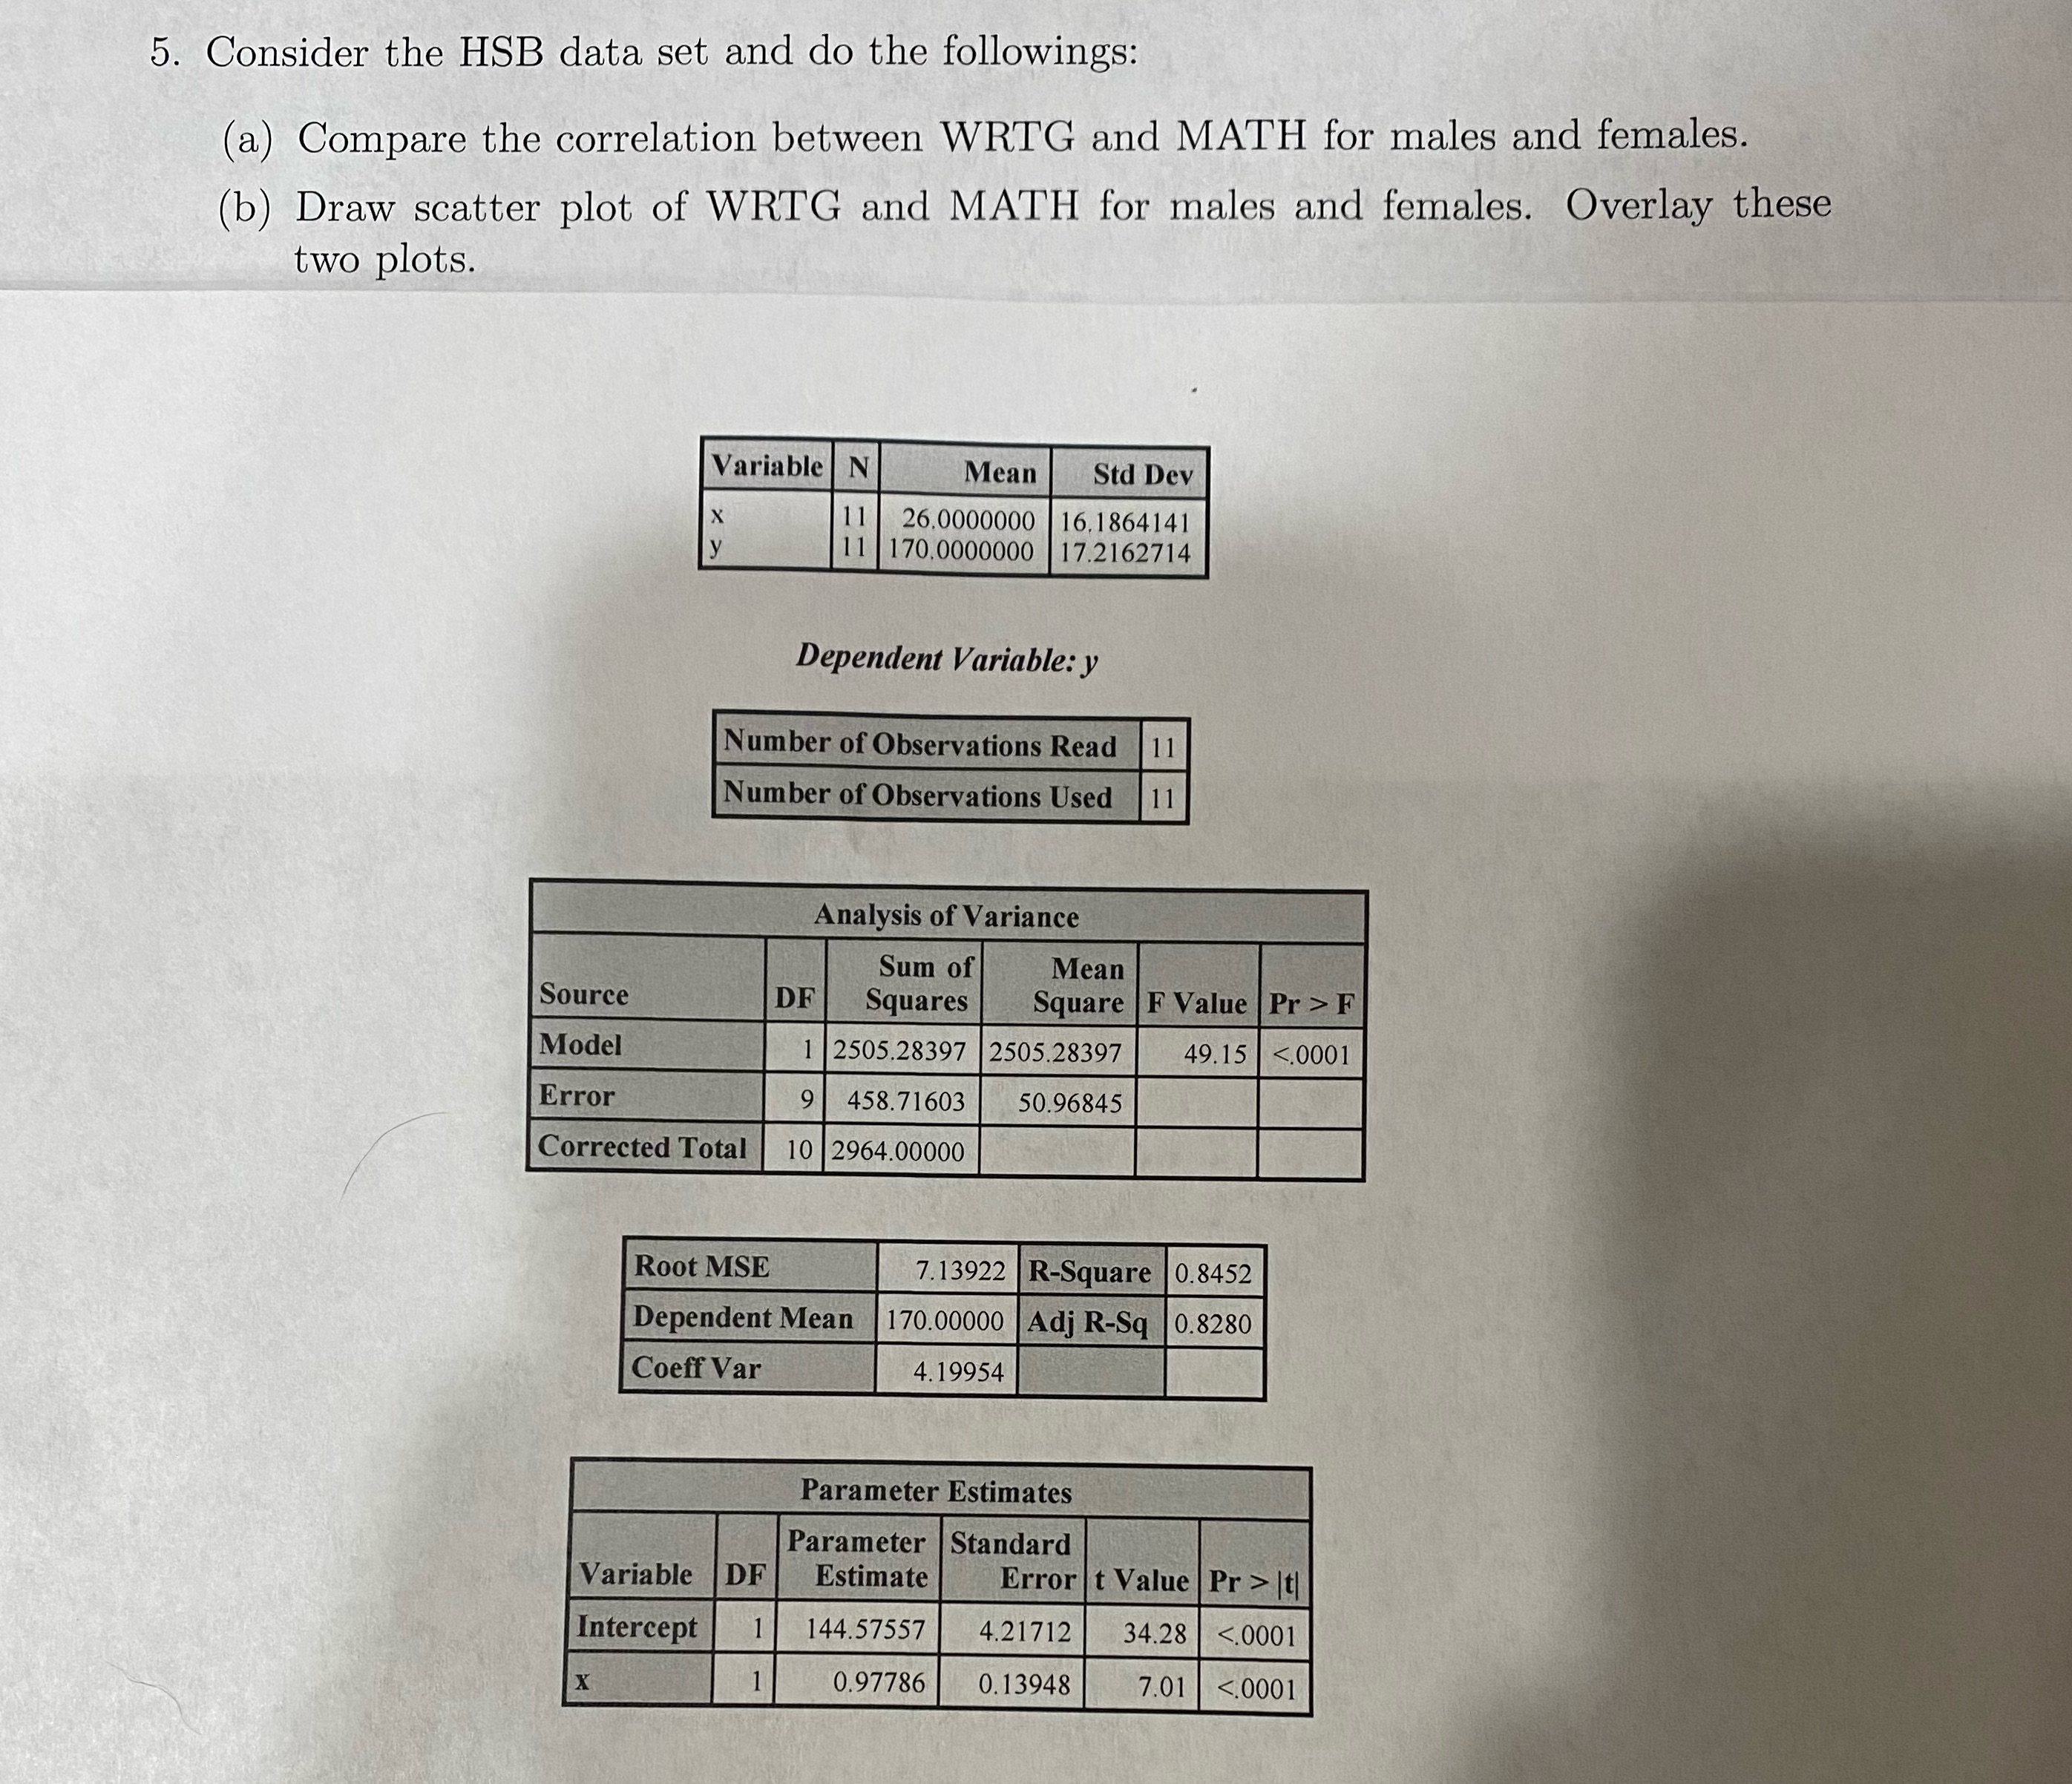
5. Consider the HSB data set and do the followings: (a) Compare the correlation between WRTG and MATH for males and females. (b) Draw scatter plot of WRTG and MATH for males and females. Overlay these two plots. Variable N Mean Std Dev 11 26.0000000 16,1864141 11 170.0000000 17.2162714 Dependent Variable: y Number of Observations Read 11 Number of Observations Used 11 Analysis of Variance Sum of Mean Source DF Squares Square | F Value | Pr > F Model 2505.28397 2505.28397 49.15 <.0001 error corrected total root mse r-square dependent mean adj r-sq coeff var parameter estimates standard variable df estimate t value pr> t Intercept 144.57557 4.21712 34.28 <.0001>
Step by Step Solution
There are 3 Steps involved in it

Get step-by-step solutions from verified subject matter experts