

Question: 5. Consider the MA(4) model with p = a) Sketch the ACF plot. 0.8, P2 = 0.6, p = 0.4 and p4 = 0.2.
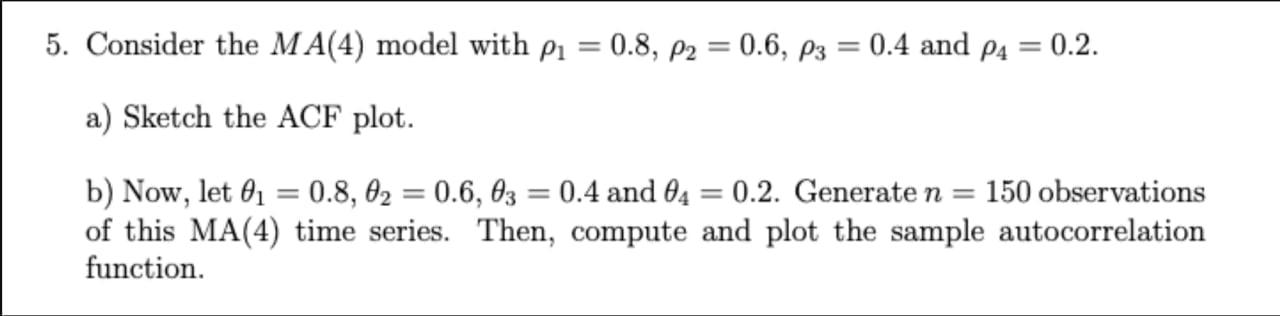
5. Consider the MA(4) model with p = a) Sketch the ACF plot. 0.8, P2 = 0.6, p = 0.4 and p4 = 0.2. b) Now, let 10.8, 0 = 0.6, 03 = 0.4 and 04 0.2. Generate n = 150 observations of this MA(4) time series. Then, compute and plot the sample autocorrelation function.
Step by Step Solution
There are 3 Steps involved in it
1 Expert Approved Answer
Step: 1 Unlock

Question Has Been Solved by an Expert!
Get step-by-step solutions from verified subject matter experts
Step: 2 Unlock
Step: 3 Unlock