

Question: 5. Create a stem and leaf plot for the data below by splitting the stems. 181, 192, 186, 180, 197, 139, 145, 146, 174, 148,
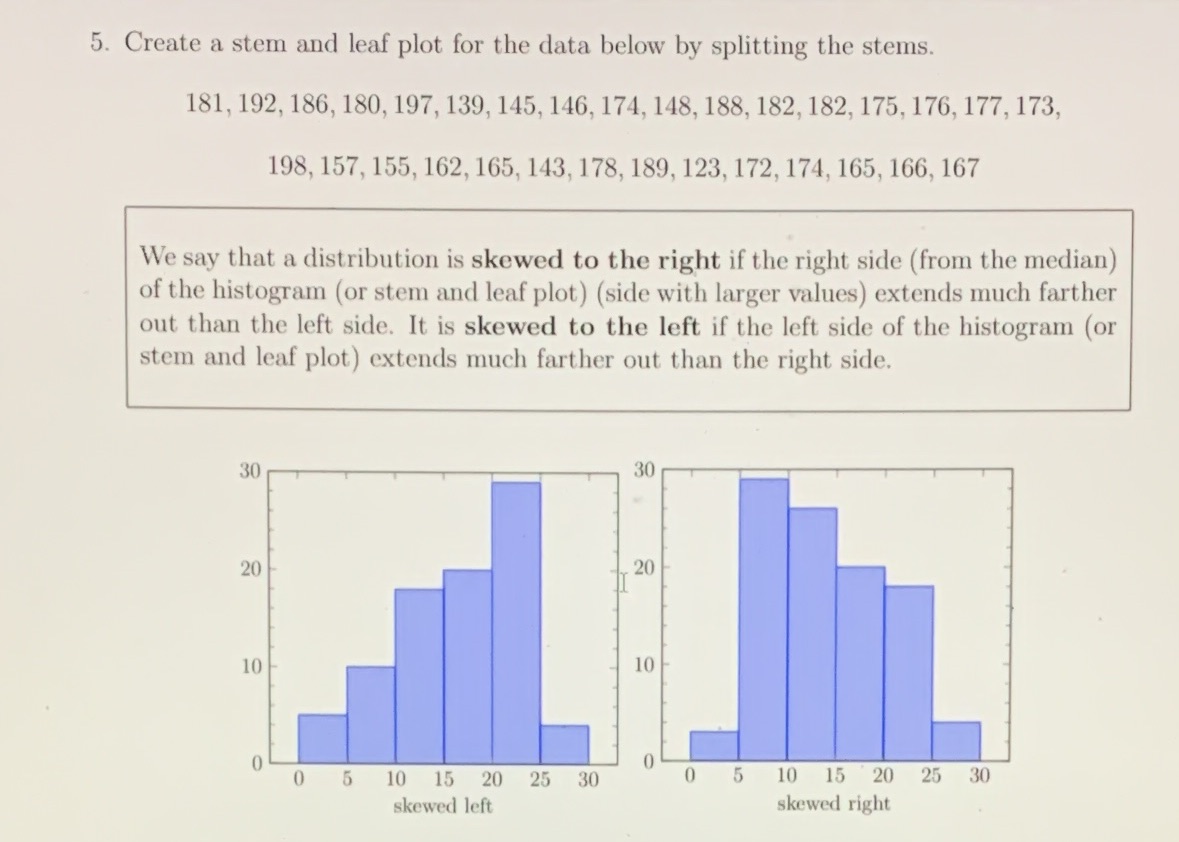
5. Create a stem and leaf plot for the data below by splitting the stems. 181, 192, 186, 180, 197, 139, 145, 146, 174, 148, 188, 182, 182, 175, 176, 177, 173, 198, 157, 155, 162, 165, 143, 178, 189, 123, 172, 174, 165, 166, 167 We say that a distribution is skewed to the right if the right side (from the median) of the histogram (or stem and leaf plot) (side with larger values) extends much farther out than the left side. It is skewed to the left if the left side of the histogram (or stem and leaf plot) extends much farther out than the right side. 30 30 20 20 10 10 0 5 10 15 20 25 30 0 5 10 15 20 25 30 skewed left skewed right
Step by Step Solution
There are 3 Steps involved in it

Get step-by-step solutions from verified subject matter experts