

Question: 5. DATA I (MA) 4 5 6 7 8 9 10 emf (mv) 12.8 17.1 20.3 24.1 27.4 31.4 34.7 6. GRAPH Plot your data
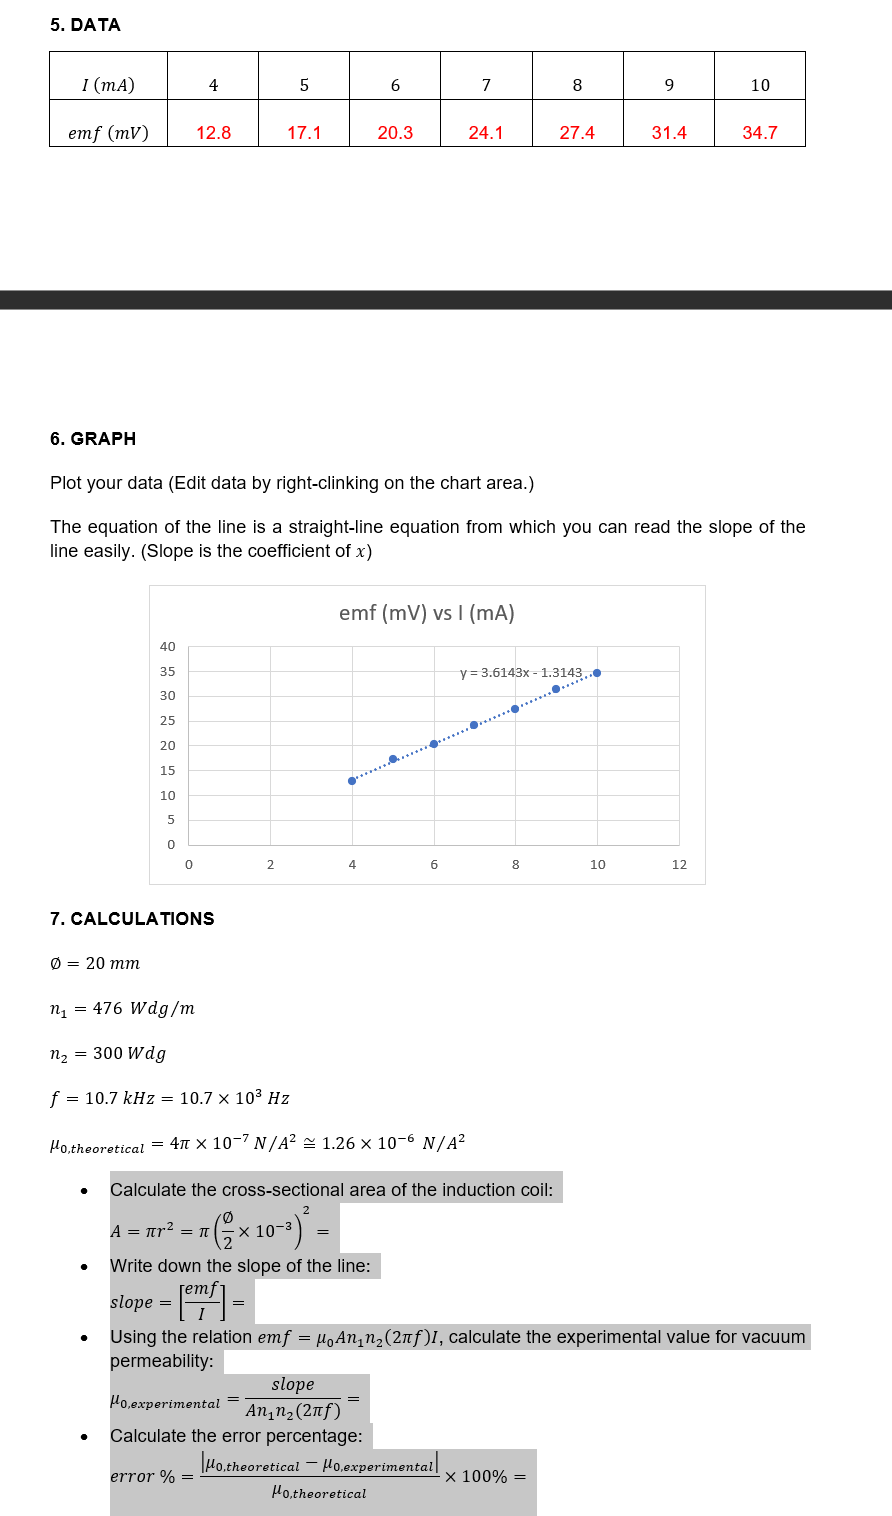
5. DATA I (MA) 4 5 6 7 8 9 10 emf (mv) 12.8 17.1 20.3 24.1 27.4 31.4 34.7 6. GRAPH Plot your data (Edit data by right-clinking on the chart area.) The equation of the line is a straight-line equation from which you can read the slope of the line easily. (Slope is the coefficient of x) emf (mV) vs I (mA) 40 35 y = 3.6143x - 1.3143... 30 25 20 15 10 O 2 4 6 8 10 12 7. CALCULATIONS D = 20 mm n1 = 476 Wdg/m n2 = 300 Wdg f = 10.7 kHz = 10.7 x 10³ Hz Po,theoretical = 41 X 10-7 N/A2 ~ 1.26 x 10⁻⁶ N/A2 Calculate the cross-sectional area of the induction coil: A = mr2 = n(5x10⁻³) - . Write down the slope of the line: slope = [ems] - Using the relation emf = MoAn,n2(2nif)1, calculate the experimental value for vacuum permeability: slope Ho,experimental = Anin2 (2nIf ) . Calculate the error percentage: error % = Ho,theoretical - Ho,experimental -X 100% = Ho,theoretical
Step by Step Solution
There are 3 Steps involved in it

Get step-by-step solutions from verified subject matter experts