

Question: 5. Data on the US 3-month T-bill rate (X, in %) and the S&P 500 index (Y) were collected from 1980 to 2007. A
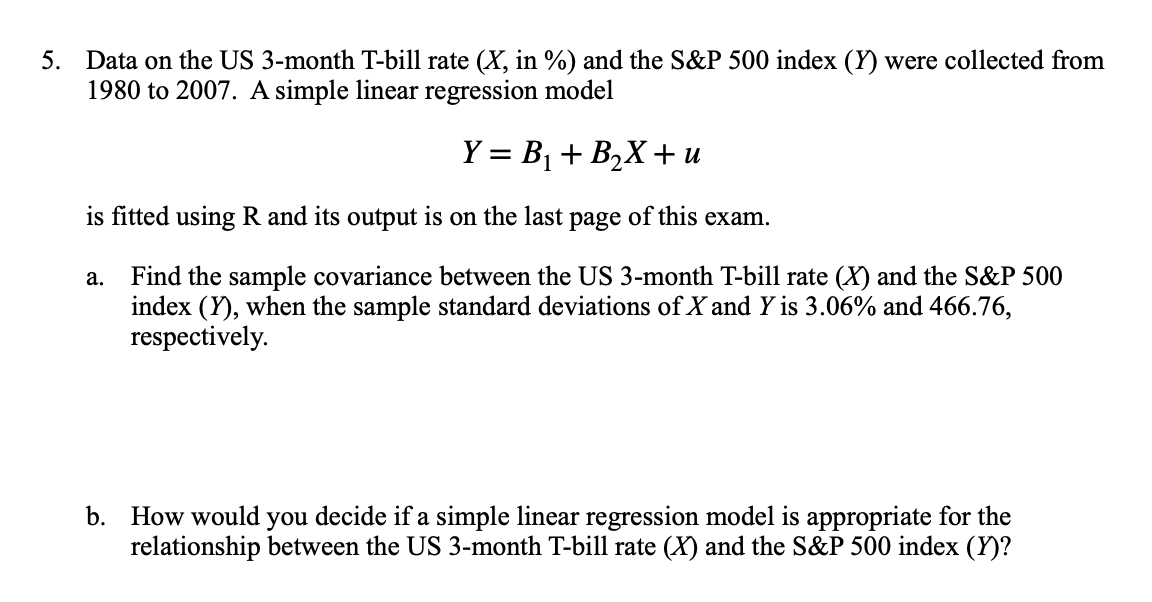
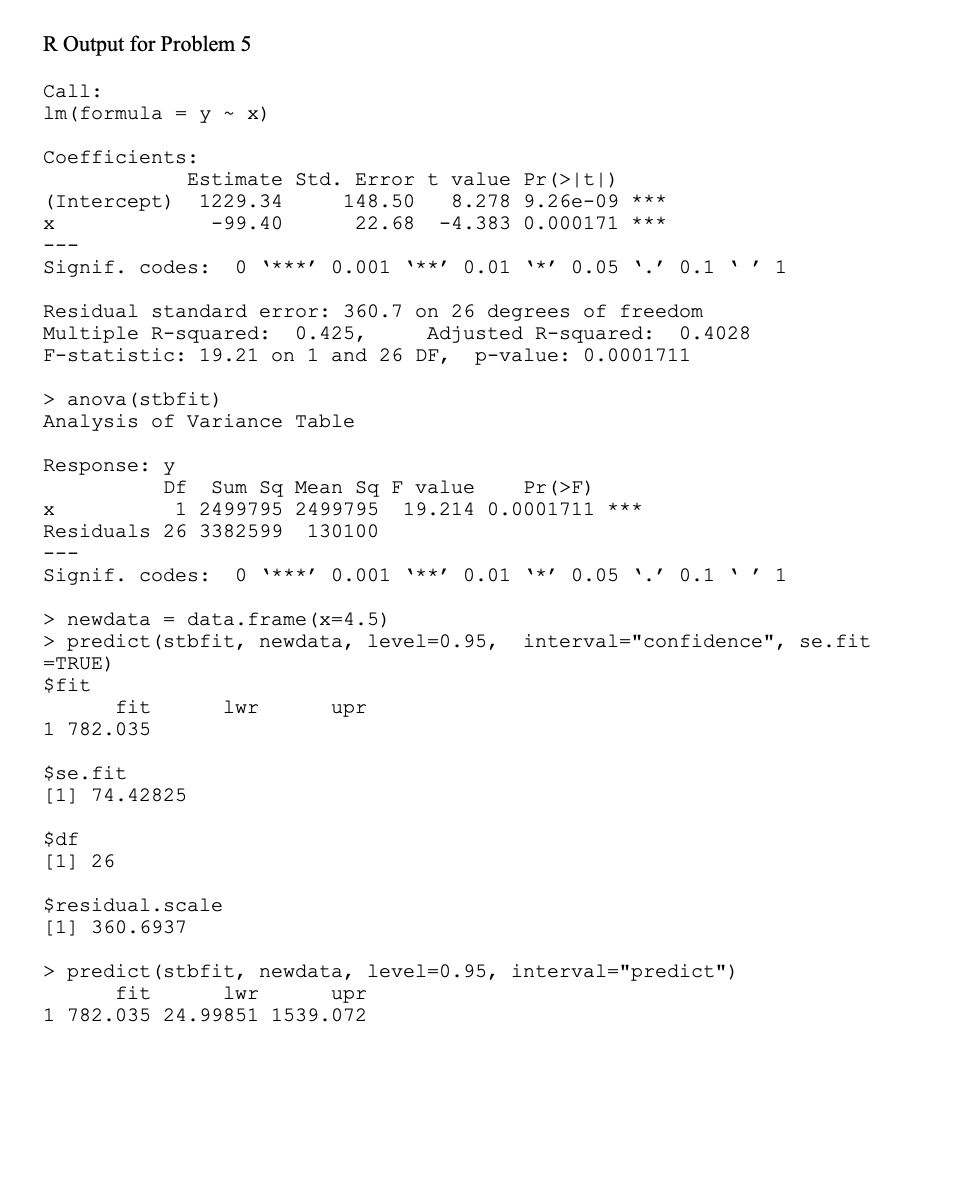
5. Data on the US 3-month T-bill rate (X, in %) and the S&P 500 index (Y) were collected from 1980 to 2007. A simple linear regression model Y = B + B2X+u is fitted using R and its output is on the last page of this exam. a. Find the sample covariance between the US 3-month T-bill rate () and the S&P 500 index (Y), when the sample standard deviations of X and Y is 3.06% and 466.76, respectively. b. How would you decide if a simple linear regression model is appropriate for the relationship between the US 3-month T-bill rate (X) and the S&P 500 index (Y)? R Output for Problem 5 Call: 1m (formula y ~ x) Coefficients: Estimate Std. Error t value Pr (>|t|) (Intercept) 1229.34 148.50 8.278 9.26e-09 *** 22.68 -4.383 0.000171 *** -99.40 ' Signif. codes: 0 1***1 0.001 *** 0.01 * 0.05 0.1 1 Residual standard error: 360.7 on 26 degrees of freedom Multiple R-squared: 0.425, Adjusted R-squared: 0.4028 F-statistic: 19.21 on 1 and 26 DF, p-value: 0.0001711 > anova (stbfit) Analysis of Variance Table Response: y X Df Sum Sq Mean Sq F value Pr (>F) 1 2499795 2499795 19.214 0.0001711 *** Residuals 26 3382599 130100 Signif. codes: 0 *** 0.001 *** 0.01 **' 0.05 0.1'' 1 > newdata data.frame (x=4.5) > predict (stbfit, newdata, level=0.95, interval="confidence", se.fit =TRUE) $fit fit lwr upr 1 782.035 $se.fit [1] 74.42825 $df [1] 26 $residual.scale [1] 360.6937 > predict (stbfit, newdata, level=0.95, interval="predict") fit lwr upr 1 782.035 24.99851 1539.072
Step by Step Solution
There are 3 Steps involved in it

Get step-by-step solutions from verified subject matter experts