

Question: 5. Drawing a yield curve Aa Aa Given the indicated maturities listed in the following table, assume the following yields for U.S. Treasury securities: Maturity
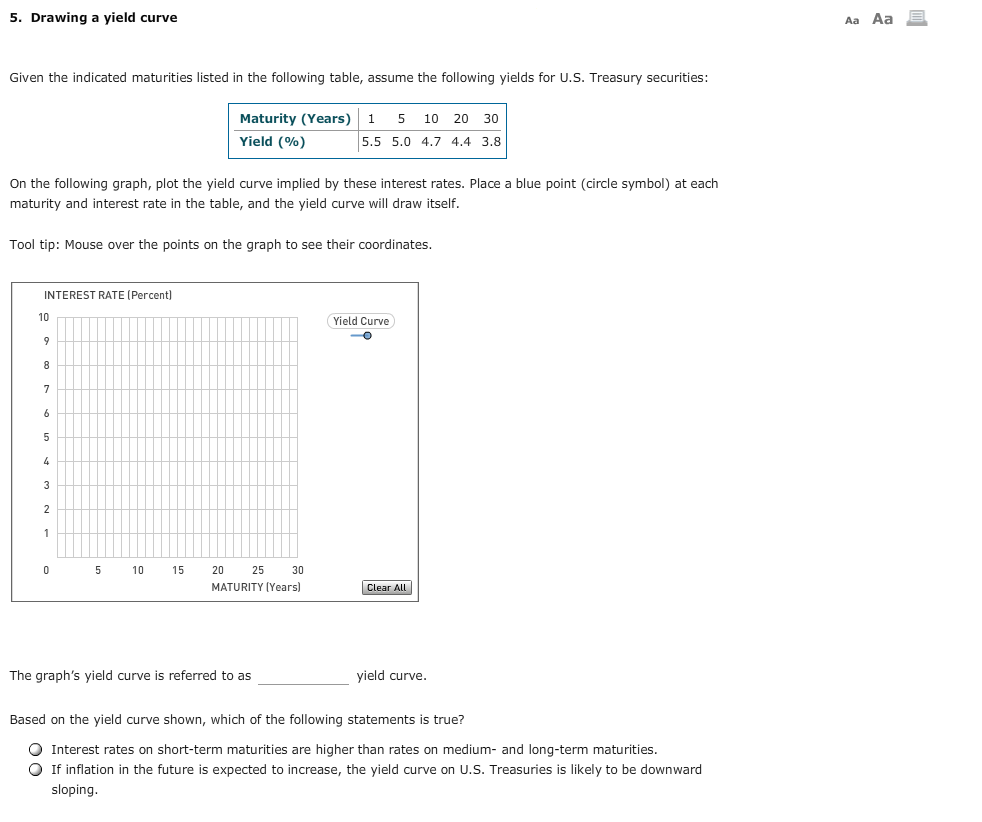
5. Drawing a yield curve Aa Aa Given the indicated maturities listed in the following table, assume the following yields for U.S. Treasury securities: Maturity (Years) 1 5 10 20 30 Yield (%) 5.5 5.0 4.7 4.4 3.8 On the following graph, plot the yield curve implied by these interest rates. Place a blue point (circle symbol) at each maturity and interest rate in the table, and the yield curve will draw itself Tool tip: Mouse over the points on the graph to see their coordinates INTEREST RATE (Percent) Yield Curve 10 15 20 25 MATURITY (Years) 30 The graph's yield curve is referred to as yield curve Based on the yield curve shown, which of the following statements is true? O Interest rates on short-term maturities are higher than rates on medium- and long-term maturities O If inflation in the future is expected to increase, the yield curve on U.S. Treasuries is likely to be downward sloping
Step by Step Solution
There are 3 Steps involved in it

Get step-by-step solutions from verified subject matter experts