

Question: 5 Exam: 02.03 Bivariate Data Mid-| X Dashboard X + X C A pvs.flvs.net/educator/student/examform.cgi?jbrenes7*parisd1*sIt=PCfr.QCAhkqKQ*5661*0007**** OF Vocaroo | Online vo... = 3 4196 WR inspire -

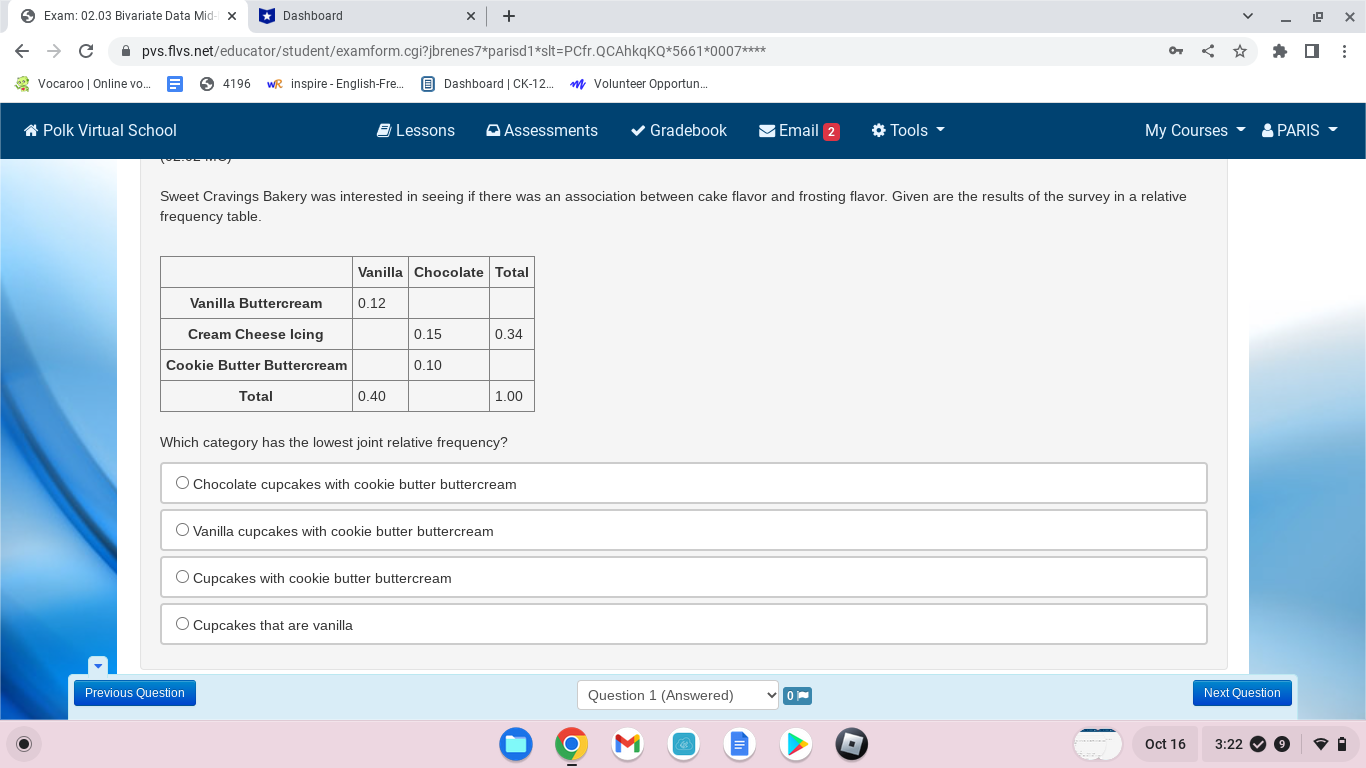
5 Exam: 02.03 Bivariate Data Mid-| X Dashboard X + X C A pvs.flvs.net/educator/student/examform.cgi?jbrenes7*parisd1*sIt=PCfr.QCAhkqKQ*5661*0007**** OF Vocaroo | Online vo... = 3 4196 WR inspire - English-Fre. Dashboard | CK-12. w Volunteer Opportun. ^ Polk Virtual School E Lessons Assessments v Gradebook Email 2 * Tools My Courses * & PARIS Sweet Cravings Bakery was interested in seeing if there was an association between cake flavor and frosting flavor. Given are the results of the survey in a relative frequency table. Vanilla Chocolate Total Vanilla Buttercream 0.12 Cream Cheese Icing 0.15 0.34 Cookie Butter Buttercream 0.10 Total 0.40 1.00 Which category has the lowest joint relative frequency? O Chocolate cupcakes with cookie butter buttercream O Vanilla cupcakes with cookie butter buttercream O Cupcakes with cookie butter buttercream O Cupcakes that are vanilla Previous Question Question 1 (Answered) VON Next Question O O Oct 16 3:22 9
Step by Step Solution
There are 3 Steps involved in it

Get step-by-step solutions from verified subject matter experts