

Question: 5 f E A B D BUSI 320 Comprehensive Problem 1 Version SUMMER Use the following information to answer the questions below: note: all sales
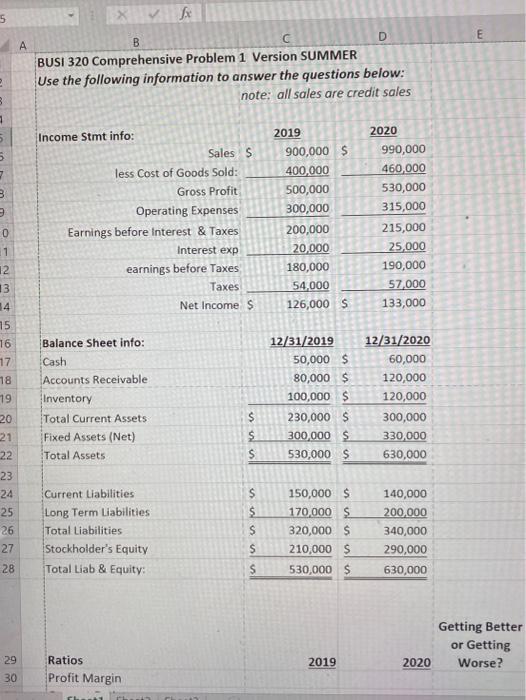
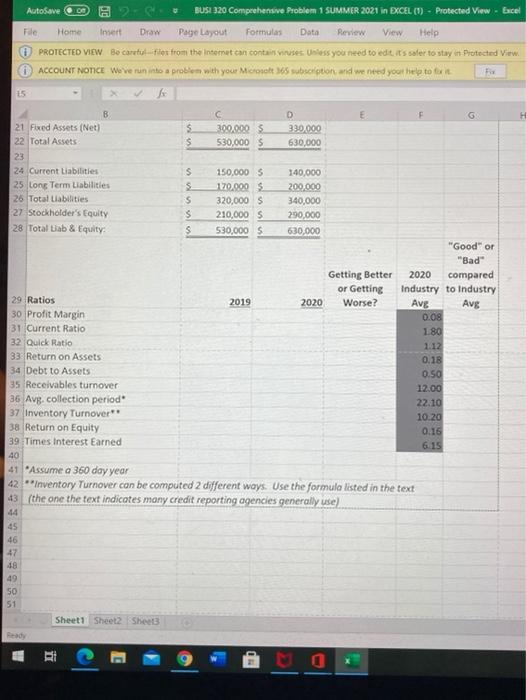
5 f E A B D BUSI 320 Comprehensive Problem 1 Version SUMMER Use the following information to answer the questions below: note: all sales are credit sales 3 5 7 3 Income Stmt info: Sales S less Cost of Goods Sold: Gross Profit Operating Expenses Earnings before interest & Taxes Interest exp earnings before Taxes Taxes Net Income $ 2019 900,000 $ 400,000 500,000 300,000 200,000 20.000 180,000 54,000 126,000 $ 2020 990,000 460,000 530,000 315,000 215,000 25,000 190,000 57,000 133,000 0 1 12 13 14 75 16 17 18 19 20 21 22 23 24 25 26 Balance Sheet info: Cash Accounts Receivable Inventory Total Current Assets Fixed Assets (Net) Total Assets 12/31/2019 50,000 $ 80,000 $ 100,000 $ 230,000 $ 300,000 $ 530,000 $ 12/31/2020 60,000 120,000 120,000 300,000 330,000 630,000 $ $ S S Current Liabilities Long Term Liabilities Total Liabilities Stockholder's Equity Total Liab & Equity: los 150,000 $ 170,000 $ 320,000 $ 210,000 $ 140,000 200,000 340,000 290,000 630,000 S 27 28 s 530,000 $ Getting Better or Getting 2020 Worse? 2019 29 30 Ratios Profit Margin AutoSave 00 BUSI 320 Comprehensive Problem 1 SUMMER 2021 in EXCEL (1) - Protected View - Excel Fle Home Insert Draw Page Layout Formulas Data Review View Help PROTECTED VIEW Be careful flow from the Internet can contain viruses. Unless you need to edit it's safer to stay in Protected View ACCOUNT NOTICE Weve run into a problem with your Microsoft subscription and we need your help to for F 15 D G 21 Fixed Assets (Net) 5 309.000 $ 330.000 22 Total Assets $ 530,000 $ 630,000 23 24 Current Liabilities s 150,000 $ 140.000 25 Long Term Liabilities 170,000 $ 200.000 26 Total Liabilities $ 320,000 S 340,000 27 Stockholder's Equity $ 210,000S 290,000 28 Total Liab & Equity $ 530,000 "Good" or "Bad" Getting Better 2020 compared or Getting Industry to Industry 29 Ratios 2019 2020 Worse? Avg Avg 30 Profit Margin 0.08 31 Current Ratio 180 32 Quick Ratio 1.12 33 Return on Assets 0.18 34 Debt to Assets 0.50 35 Receivables turnover 12.00 36 Avg. collection period 22.10 37 Inventory Turnover 10.20 38 Return on Equity 0.16 39 Times Interest Earned 6.15 40 41 Assume a 360 day year 42 inventory Turnover can be computed 2 different ways. Use the formula listed in the text 43 (the one the text indicates many credit reporting agencies generally use) 44 45 46 47 48 49 50 51 Sheet1 Sheet2 Sheet RI
Step by Step Solution
There are 3 Steps involved in it

Get step-by-step solutions from verified subject matter experts