

Question: 5. FX EXPOSURE : Comment on the Foreign Exchange (FX) risk exposure the company has due to its global presence. In addition, explain with examples
(12 marks)
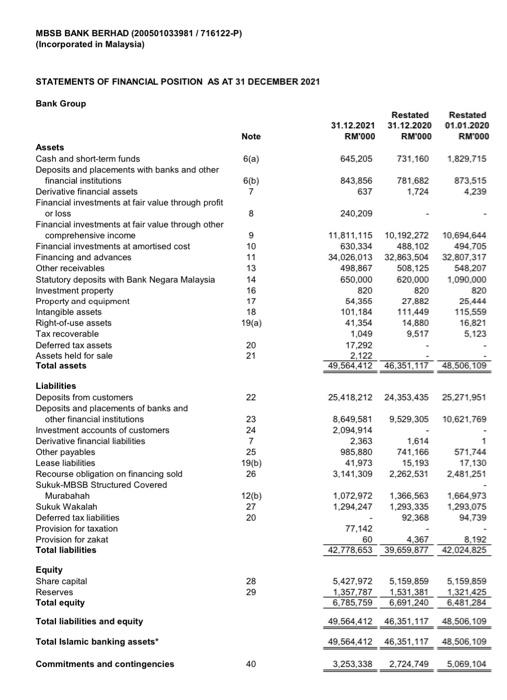
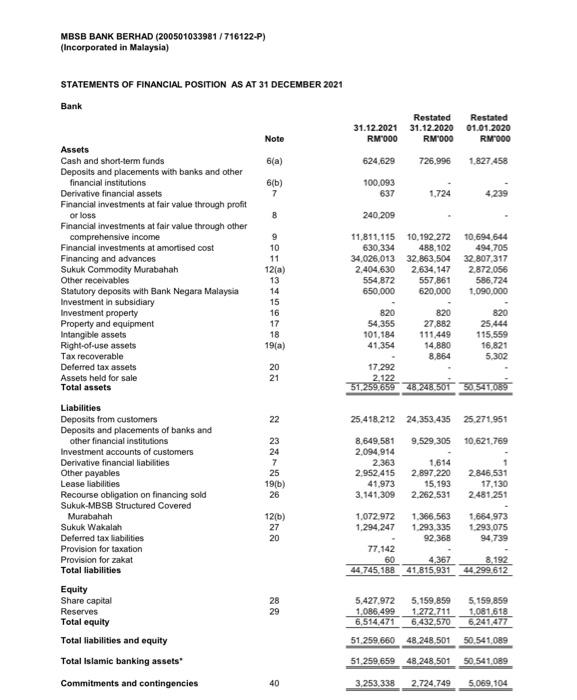
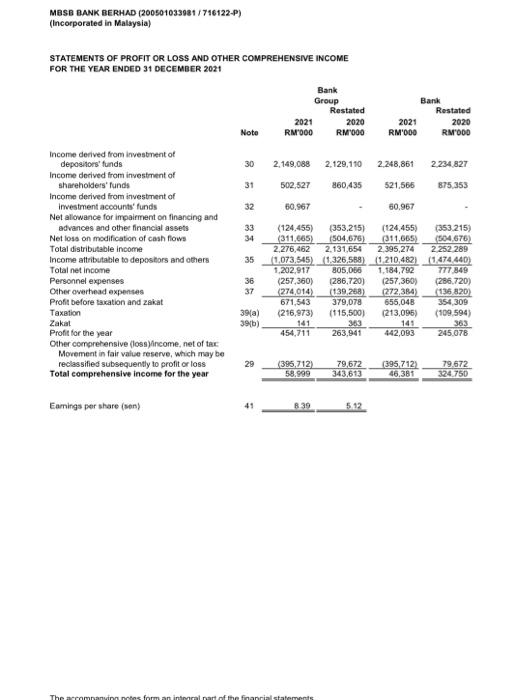
MBSB BANK BERHAD (200501033981/ 716122-P) (Incorporated in Malaysia) STATEMENTS OF FINANCIAL POSITION AS AT 31 DECEMBER 2021 Bank Group Restated 31.12.2021 31.12.2020 RM1000 RM 000 Restated 01.01.2020 RM 000 Note 6(a) 645,205 731,160 1.829,715 6[6) 7 B43,856 637 781.682 1,724 873,515 4.239 8 240,209 9 10 11 13 14 16 17 18 19(a) 11,811,115 10,192,272 10,694,644 630,334 488,102 494 705 34,026,013 32,863.504 32,807,317 498,867 508,125 548,207 650,000 620,000 1,090,000 820 820 820 54,365 27.882 25.444 101,184 111.449 115,559 41,354 14 880 16.821 1,049 9,517 5,123 17,292 2,122 49.564,412 46,351,117 48.506.109 20 21 Assets Cash and short-term funds Deposits and placements with banks and other financial institutions Derivative financial assets Financial investments at fair value through profit or loss Financial investments at fair value through other comprehensive income Financial investments at amortised cost Financing and advances Other receivables Statutory deposits with Bank Negara Malaysia Investment property Property and quipment Intangible assets Right-of-use assets Tax recoverable Deferred tax assets Assets held for sale Total assets Liabilities Deposits from customers Deposits and placements of banks and other financial institutions Investment accounts of customers Derivative financial liabilities Other payables Lease liabilities Recourse obligation on financing sold Sukuk-MBSB Structured Covered Murabahah Sukuk Wakalah Deferred tax liabilities Provision for taxation Provision for zakat Total liabilities Equity Share capital Reserves Total equity Total liabilities and equity Total Islamic banking assets 22 25,418,212 24,353,435 25,271,951 9,529,305 10.621,769 23 24 7 25 19(b) 26 8,649,581 2,094,914 2,363 985,880 41,973 3.141,309 1.614 741,166 15,193 2,262,531 571.744 17,130 2,481.251 12(b) 27 20 1,072,972 1,294,247 1,366,563 1,293,335 92,368 1,664,973 1.293,075 94.739 77.142 60 42.778,653 4,367 39,659.877 8,192 42,024,825 28 29 5,427,972 1.357787 6.785,759 5.159.859 1,531,381 6,691 240 5.159.859 1.321,425 6.481.284 49.564,412 46,351.117 48.506,109 49.564,412 46,351.117 48.506,109 Commitments and contingencies 40 3,253,338 2.724.749 5,069,104 MBSB BANK BERHAD (200501033981/716122-P) (Incorporated in Malaysia) STATEMENTS OF FINANCIAL POSITION AS AT 31 DECEMBER 2021 Bank Restated Restated 31.12.2021 31.12.2020 01.01.2020 RM000 RM000 RMOOO Note 6(a) 624,629 726.996 1,827 458 6(b) 7 100.093 637 1.724 4.239 8 240.209 Assets Cash and short-term funds Deposits and placements with banks and other financial institutions Derivative financial assets Financial investments at fair value through profit or loss Financial investments at fair value through other comprehensive income Financial investments at amortised cost Financing and advances Sukuk Commodity Murabahah Other receivables Statutory deposits with Bank Negara Malaysia Investment in subsidiary Investment property Property and equipment Intangible assets Right-of-use assets Tax recoverable Deferred tax assets Assets held for sale Total assets 9 10 11 12(a) 13 14 15 16 17 18 11,811,115 10.192.272 630,334 488,102 34,026,013 32.863,504 2.404.630 2.634,147 554 872 557 861 650.000 620,000 10.694.644 494,705 32.807,317 2.872.056 586.724 1,090.000 820 54 355 101,184 41.354 820 27,882 111449 14.880 8.864 820 25.444 115.559 16,821 5.302 19(a) 17.292 20 21 2. 122 51.259.659 48.248.501 30.541.089 22 25.418.212 24,353.435 25.271.951 9,529,305 10,621,769 23 24 7 25 19(b) 26 8,649,581 2,094,914 2.363 2.952.415 41,973 3.141,309 1,614 2.897.220 15,193 2.262,531 2846.531 17,130 2481251 Liabilities Deposits from customers Deposits and placements of banks and other financial institutions Investment accounts of customers Derivative financial liabilities Other payables Lease liabilities Recourse obligation on financing sold Sukuk-MBSB Structured Covered Murabahah Sukuk Wakalah Deferred tax liabilities Provision for taxation Provision for zakat Total liabilities Equity Share capital Reserves Total equity Total liabilities and equity Total Islamic banking assets 12(0) 27 20 1.684973 1.293.075 94,739 1.072.972 1.366,563 1.294,247 1.293.335 92,368 77,142 60 4,367 44,745,188 41,815,931 8.192 44.299 612 28 29 5,427.972 1,086,499 6,514,471 5.159,859 1.272.711 6.432,570 5.159,859 1,081,618 6.241,477 51.259.660 48.248.501 50 541,089 51,259,659 48,248,501 50,541,089 Commitments and contingencies 40 3.253.338 2.724.749 5.069,104 MBSB BANK BERHAD (200501033081/716122-P) (Incorporated in Malaysia) STATEMENTS OF PROFIT OR LOSS AND OTHER COMPREHENSIVE INCOME FOR THE YEAR ENDED 31 DECEMBER 2021 Bank Group Restated 2020 RM000 2021 RM000 Bank Restated 2021 2020 RM'ODO RMODO Note 30 2.149.088 2.129.110 2.248,861 2.234 827 31 502,527 860435 521,566 875.353 32 60.967 60.967 33 34 35 Income derived from investment of depositors' funds Income derived from investment of shareholders' funds Income derived from investment of Investment accounts' funds Net alowance for impairment on financing and advances and other financial assets Netloss on modification of cash flows Total distributable income Income attributable to depositors and others Total net income Personnel expenses Other overhead expenses Profit before taxation and zakat Taxation Zakat Profit for the year Other comprehensive (lossincome, net of the Movement in fair value reserve, which may be reclassified subsequently to profit or loss Total comprehensive income for the year 36 37 (124,455) (353,215) (124,455) (353.215) (311,065) 1504,676) 311,065) (504.676) 2,276,462 2.131.654 2.395,274 2 252 289 (1,073,545) (1.326,588) (1.210,482) (1.474.440) 1,202,917 805,086 1,184,792 777 849 (257,360) 1286,720) (257,360) (286.720) (274,014) (139,268) (272,384) 136 820) 671,543 379,078 656,048 354309 (216,973) (115,500) (213,095) (109.594) 141 363 141 363 454,711 263,941 442,093 245.078 39(a) 391) 29 (395,712) 58.999 79,672 343,613 (395,712) 46,387 79,672 324 750 Earings per share (son) 41 8.39 5.12 The amanuntes forman intialart of the financial statements
Step by Step Solution
There are 3 Steps involved in it

Get step-by-step solutions from verified subject matter experts