

Question: 5) Given the income statement for the MLC (Table 4-7) and balance sheet (Table 4-4), answer the following: a) Calculate the following ratios for 2013:
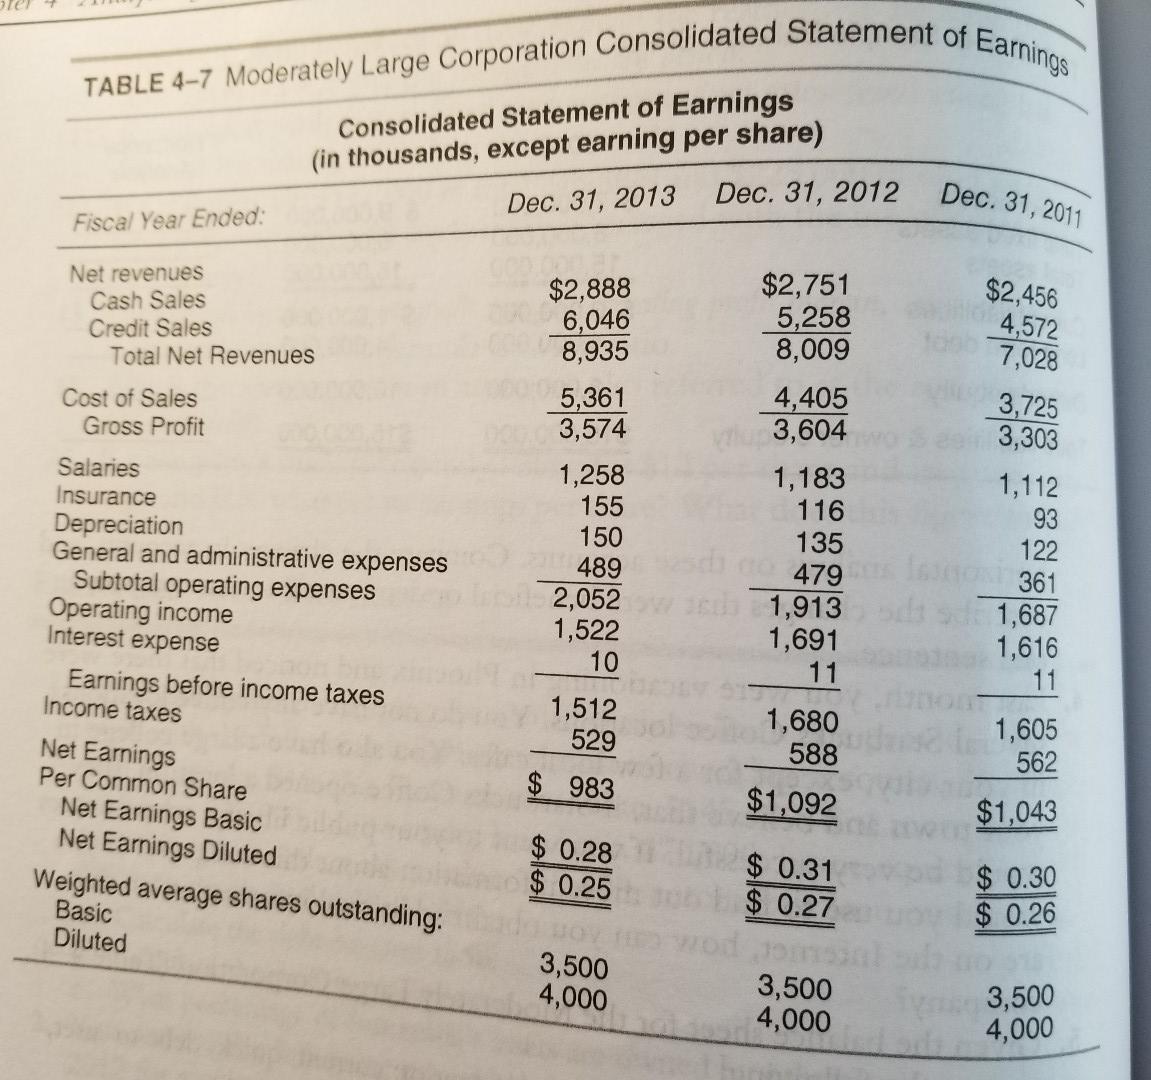
5) Given the income statement for the MLC (Table 4-7) and balance sheet (Table 4-4), answer the following: a) Calculate the following ratios for 2013: operating profit margin, net profit margin, operating return on assets, net return on assets, and return on equity. b) In a written explanation, describe what each of these ratios means. c) In a brief paragraph, describe the overall profitability of the MLC. TABLE 4-7 Moderately Large Corporation Consolidated Statement of Earnings Consolidated Statement of Earnings (in thousands, except earning per share) Dec. 31, 2013 Dec. 31, 2012 Dec. 31, 2011 Fiscal Year Ended: Net revenues Cash Sales Credit Sales Total Net Revenues $2,456 4,572 7,028 Cost of Sales Gross Profit $2,888 6,046 8,935 5,361 3,574 1,258 155 150 489 2,052 1,522 10 1,512 529 Salaries Insurance Depreciation General and administrative expenses Subtotal operating expenses Operating income Interest expense Earnings before income taxes Income taxes Net Earnings Per Common Share Net Earnings Basic Net Earnings Diluted Weighted average shares outstanding: Basic Diluted $2,751 5,258 8,009 4,405 3,604 1,183 116 135 479 1,913 1,691 11 - 1,680 588 3,725 3,303 1,112 93 122 361 1,687 1,616 11 1,605 562 $ 983 $1,092 $1,043 $ 0.28 $ 0.25 $ 0.31 $ 0.27 $ 0.30 $ 0.26 3,500 4,000 3,500 4,000 3,500 4,000 5) Given the income statement for the MLC (Table 4-7) and balance sheet (Table 4-4), answer the following: a) Calculate the following ratios for 2013: operating profit margin, net profit margin, operating return on assets, net return on assets, and return on equity. b) In a written explanation, describe what each of these ratios means. c) In a brief paragraph, describe the overall profitability of the MLC. TABLE 4-7 Moderately Large Corporation Consolidated Statement of Earnings Consolidated Statement of Earnings (in thousands, except earning per share) Dec. 31, 2013 Dec. 31, 2012 Dec. 31, 2011 Fiscal Year Ended: Net revenues Cash Sales Credit Sales Total Net Revenues $2,456 4,572 7,028 Cost of Sales Gross Profit $2,888 6,046 8,935 5,361 3,574 1,258 155 150 489 2,052 1,522 10 1,512 529 Salaries Insurance Depreciation General and administrative expenses Subtotal operating expenses Operating income Interest expense Earnings before income taxes Income taxes Net Earnings Per Common Share Net Earnings Basic Net Earnings Diluted Weighted average shares outstanding: Basic Diluted $2,751 5,258 8,009 4,405 3,604 1,183 116 135 479 1,913 1,691 11 - 1,680 588 3,725 3,303 1,112 93 122 361 1,687 1,616 11 1,605 562 $ 983 $1,092 $1,043 $ 0.28 $ 0.25 $ 0.31 $ 0.27 $ 0.30 $ 0.26 3,500 4,000 3,500 4,000 3,500 4,000
Step by Step Solution
There are 3 Steps involved in it

Get step-by-step solutions from verified subject matter experts