

Question: 5. Graph the insolation data below which shows insolation monthly averages near the surface. Note this 6. Finish the table. To complete the first column,
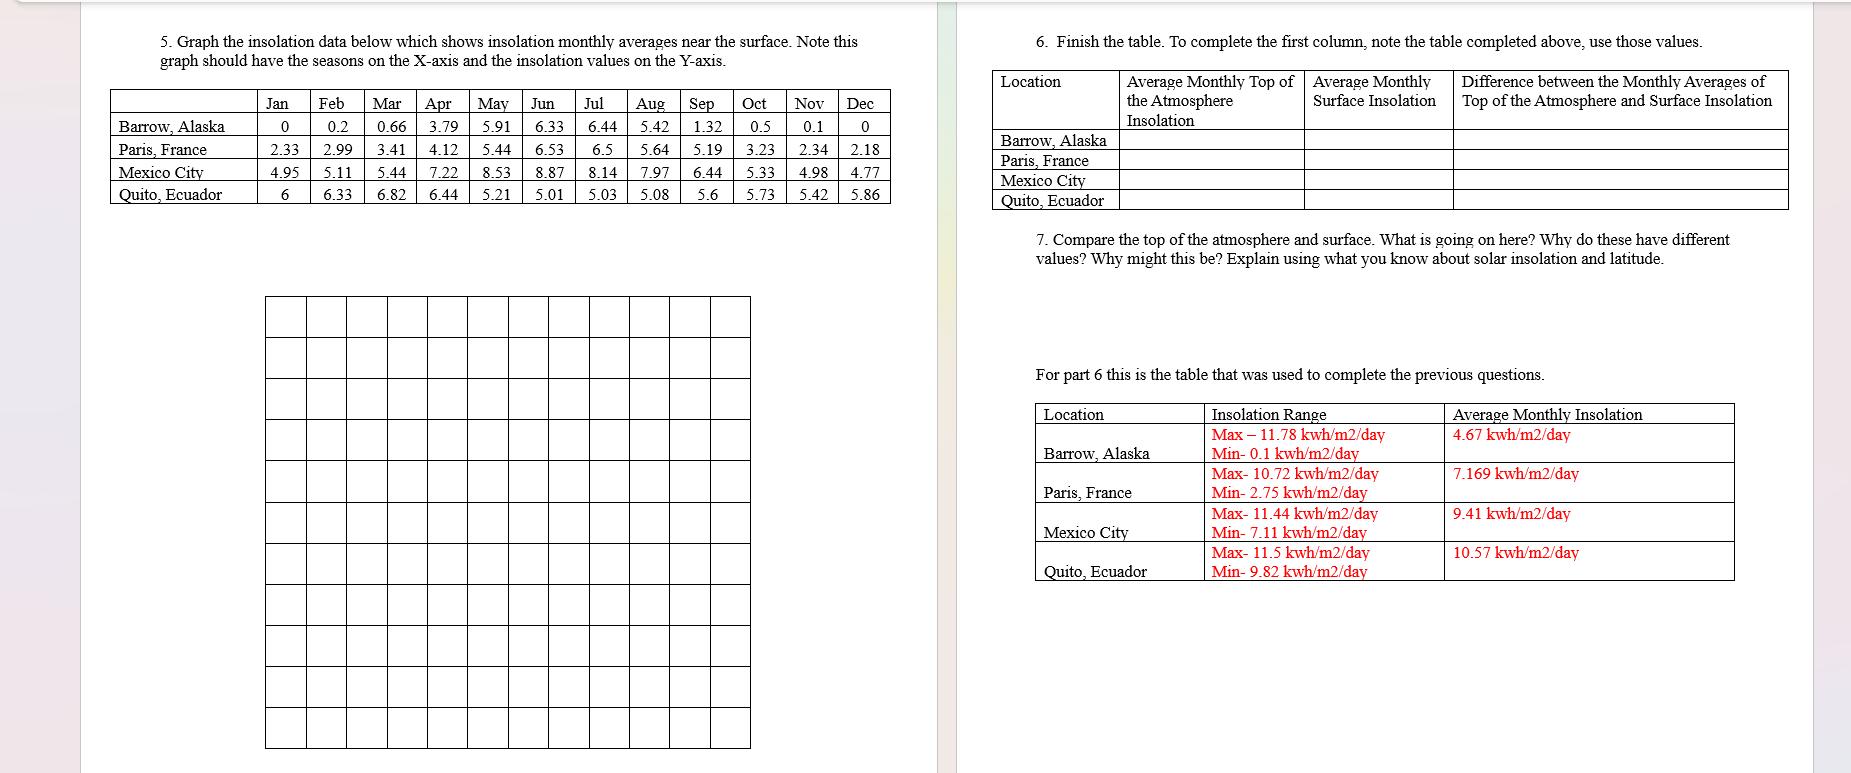
5. Graph the insolation data below which shows insolation monthly averages near the surface. Note this 6. Finish the table. To complete the first column, note the table completed above, use those values. graph should have the seasons on the X-axis and the insolation values on the Y-axis. 7. Compare the top of the atmosphere and surface. What is going on here? Why do these have different values? Why might this be? Explain using what you know about solar insolation and latitude. For part 6 this is the table that was used to complete the previous questions. 5. Graph the insolation data below which shows insolation monthly averages near the surface. Note this 6. Finish the table. To complete the first column, note the table completed above, use those values. graph should have the seasons on the X-axis and the insolation values on the Y-axis. 7. Compare the top of the atmosphere and surface. What is going on here? Why do these have different values? Why might this be? Explain using what you know about solar insolation and latitude. For part 6 this is the table that was used to complete the previous questions
Step by Step Solution
There are 3 Steps involved in it

Get step-by-step solutions from verified subject matter experts