

Question: 5. Graph the points in the table below on a rectangular scale and then on a logarithmic scale. Label each point with the first letter
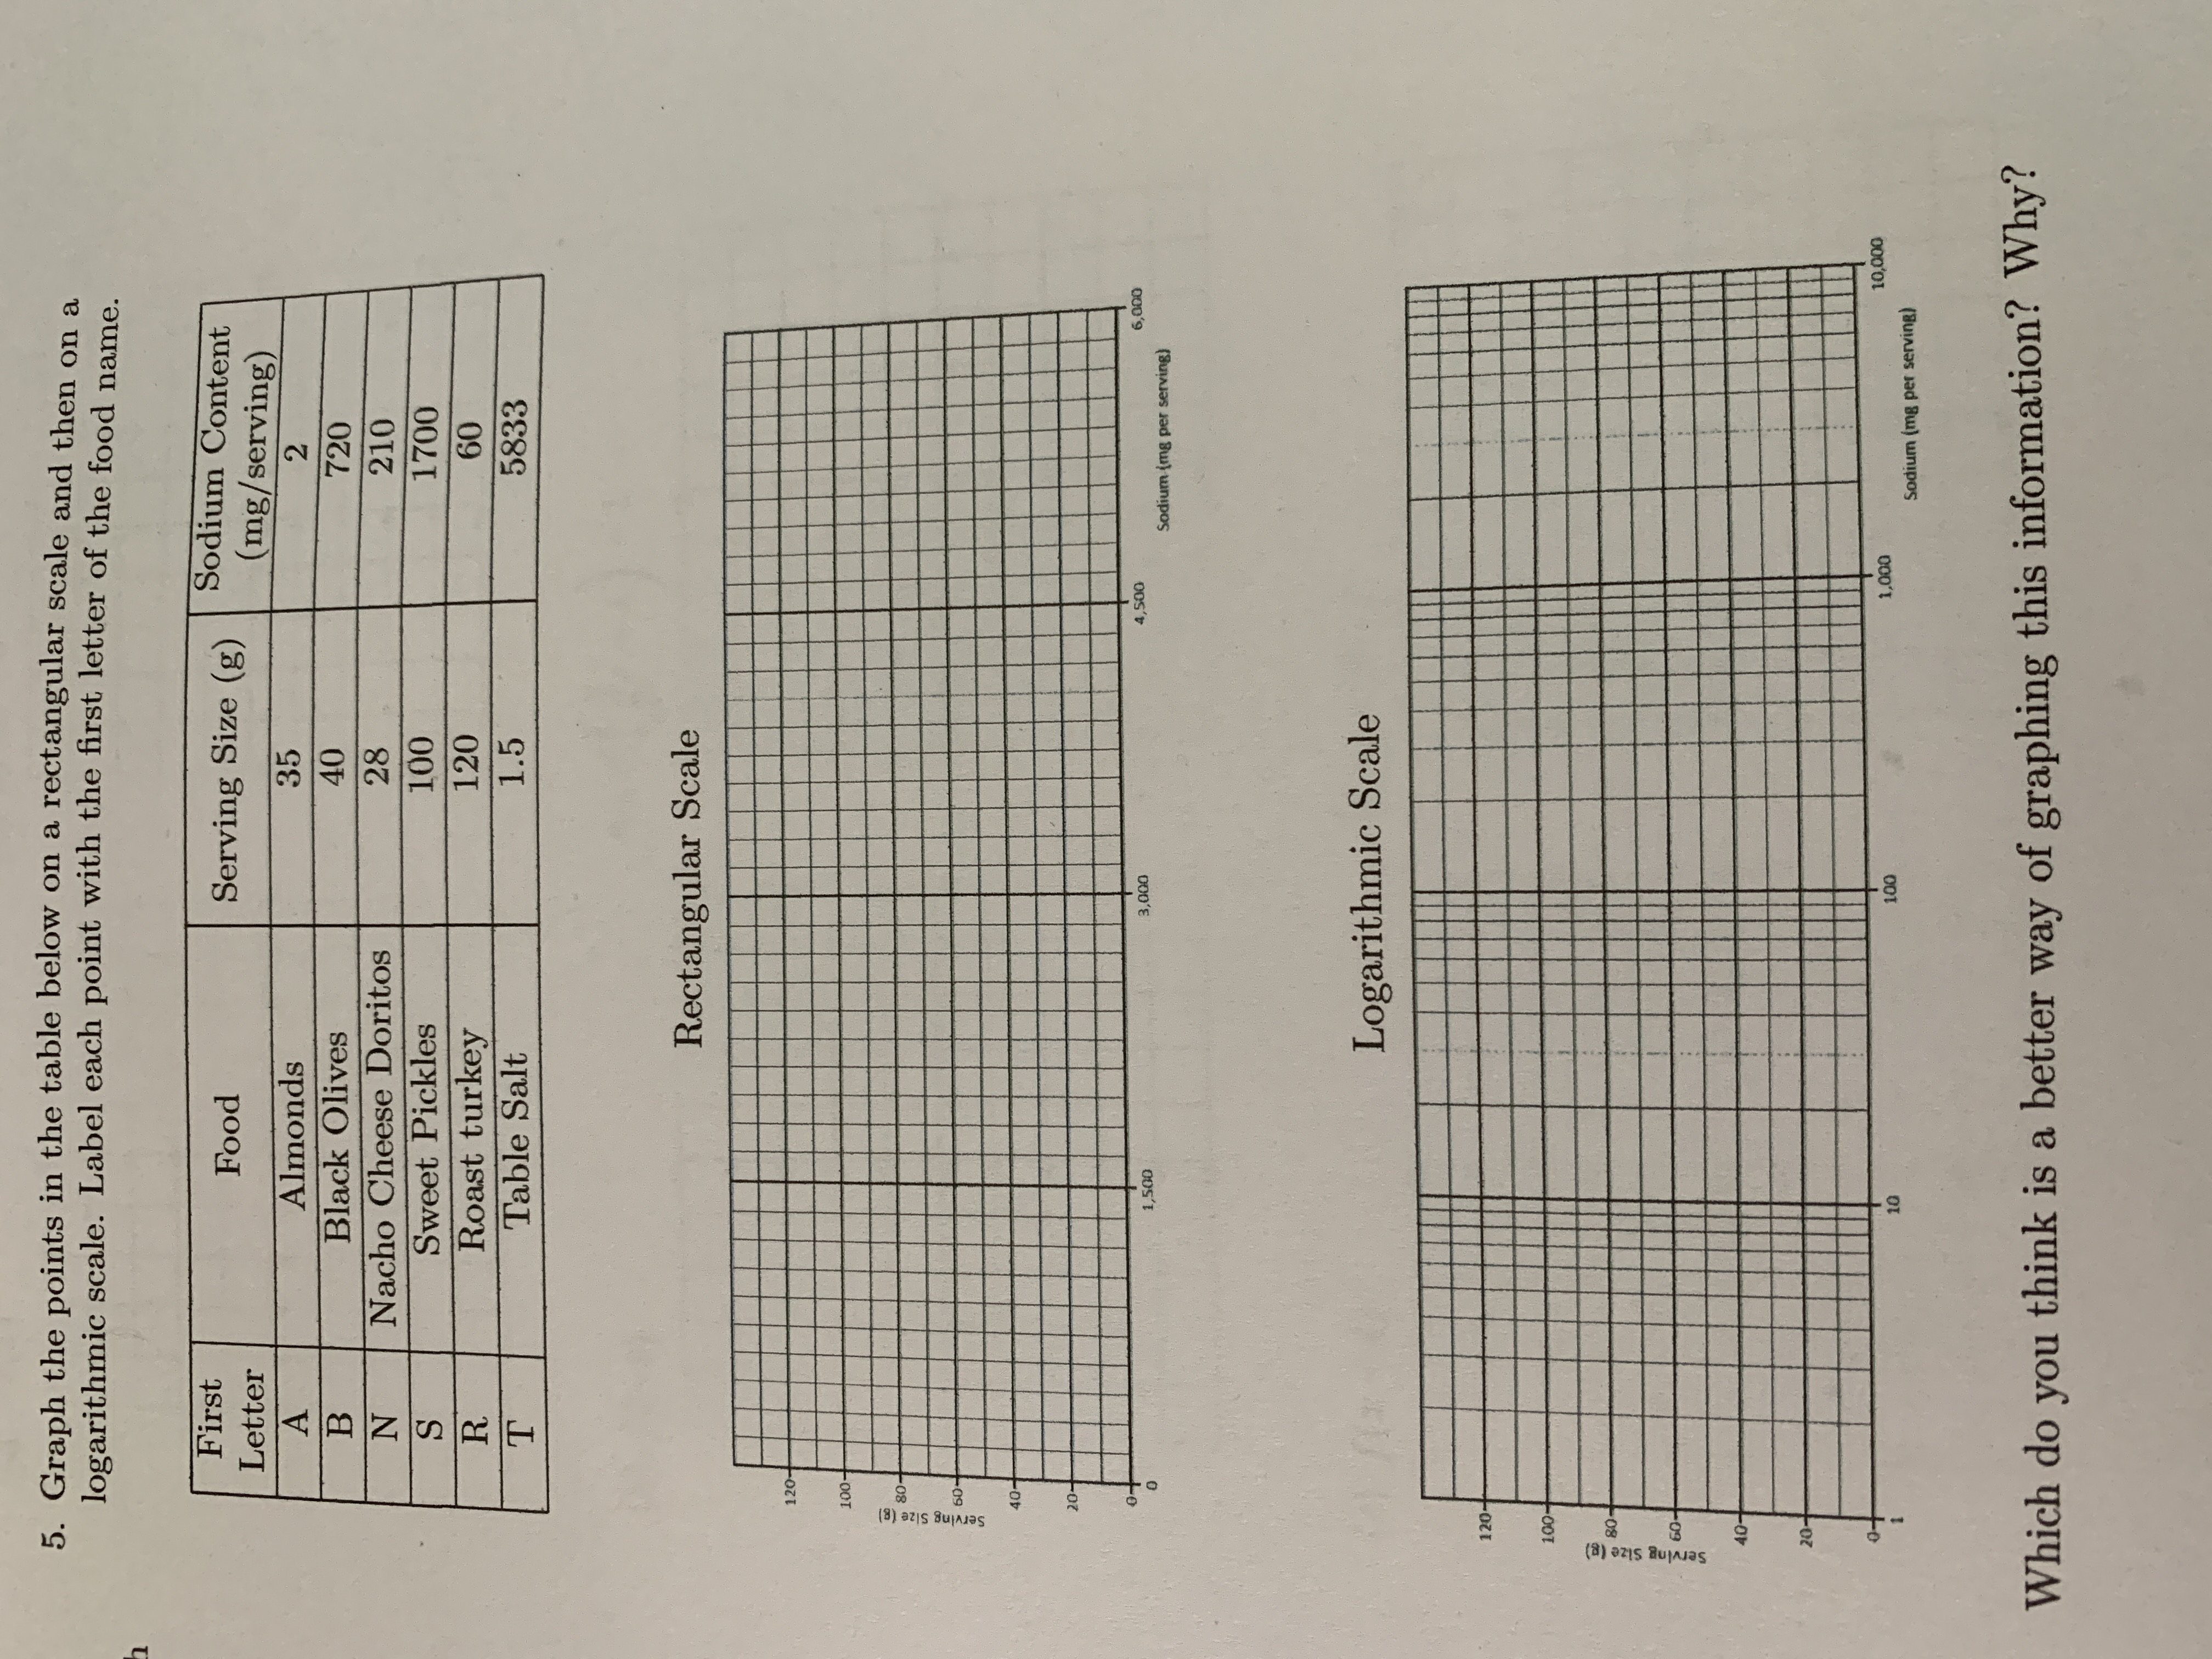
5. Graph the points in the table below on a rectangular scale and then on a logarithmic scale. Label each point with the first letter of the food name. First Letter Food Serving Size (g) Sodium Content A Almonds 35 (mg/ serving) 2 B Black Olives 40 720 N Nacho Cheese Doritos 28 210 S Sweet Pickles 100 1700 R Roast turkey 120 60 T Table Salt 1.5 5833 Rectangular Scale 120- 100 - Serving Size (8) 80- 50 40- 1,500 3,000 4,500 6,000 Sodium (mg per serving) Logarithmic Scale 120- 100- Serving Size (8) 80- 50- 40 - 100 1,000 10,000 Sodium (mg per serving) Which do you think is a better way of graphing this information? Why
Step by Step Solution
There are 3 Steps involved in it
1 Expert Approved Answer
Step: 1 Unlock

Question Has Been Solved by an Expert!
Get step-by-step solutions from verified subject matter experts
Step: 2 Unlock
Step: 3 Unlock