

Question: 5. Graphical analysis: Need assistance generating bubble chart Graph Publishers on a bubble chart (in Excel, pick Bubble Chart) using the following dimensions: X=Probability of
5. Graphical analysis: Need assistance generating bubble chart
-
Graph Publishers on a bubble chart (in Excel, pick Bubble Chart) using the following dimensions: X=Probability of Booking, Y=Cost Per Click, Bubble Size=Total Costs.
-
Create four quadrants by drawing a line at the publisher average for CPC and another
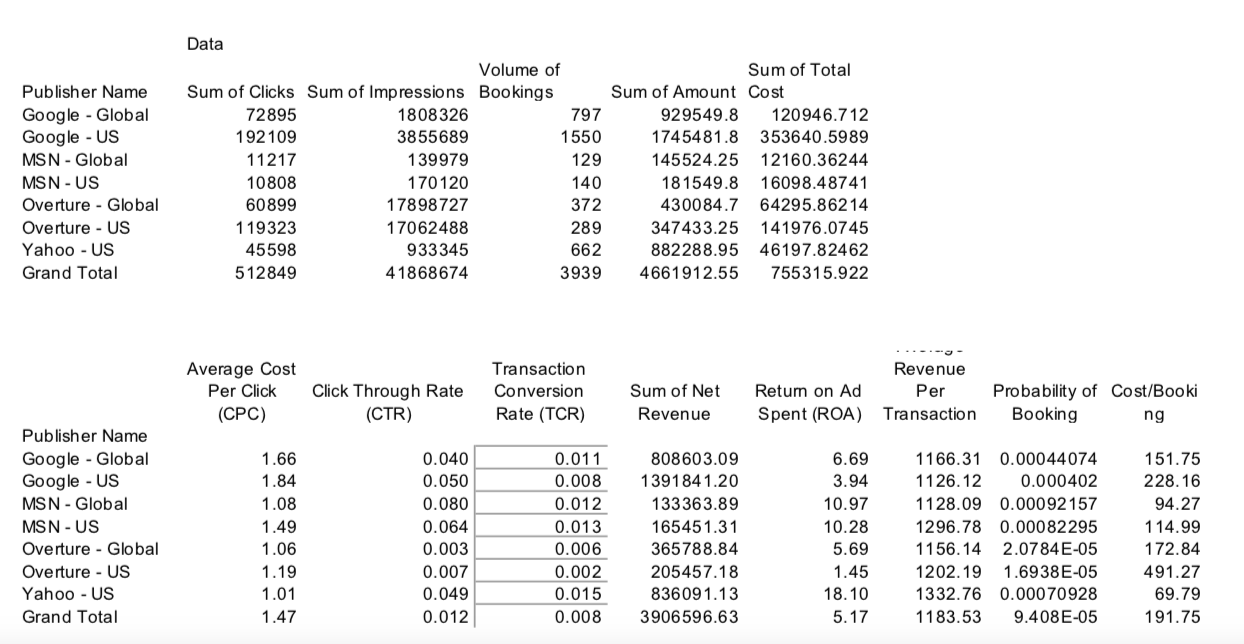
line at the publisher average for probability of booking.
Observe the quadrant in which a publisher falls.
Data Publisher Name Google - Global Google - US MSN - Global MSN - US Overture - Global Overture - US Yahoo - US Grand Total Volume of Sum of Total Sum of Clicks Sum of Impressions Bookings Sum of Amount Cost 72895 1808326 797 929549.8 120946.712 192109 3855689 1550 1745481.8 353640.5989 11217 139979 129 145524.25 12160.36244 10808 170120 140 181549.8 16098.48741 60899 17898727 372 430084.7 64295.86214 1 19323 17062488 289 347433.25 141976.0745 45598 933345 662 882288.95 46197.82462 512849 41868674 3939 4661912.55 755315.922 Average Cost Per Click (CPC) Click Through Rate (CTR) Transaction Conversion Rate (TCR) Sum of Net Revenue Retum on Ad Spent (ROA) Revenue Per Transaction Probability of Cost/Booki Booking ng Publisher Name Google - Global Google - US MSN - Global MSN - US Overture - Global Overture - US Yahoo - US Grand Total 1.66 1.84 1.08 1.49 1.06 1.19 1.01 1.47 0.040 0.050 0.080 0.064 0.003 0.007 0.049 0.012 0.011 0.008 0.012 0.013 0.006 0.002 0.015 0.008 808603.09 139184 1.20 133363.89 165451.31 365788.84 205457.18 83609 1.13 3906596.63 6.69 3.94 10.97 10.28 5.69 1.45 18.10 5.17 1166.31 0.00044074 1126.12 0.000402 1128.09 0.00092157 1296.78 0.00082295 1156.14 2.0784E-05 1202.19 1.6938E-05 1332.76 0.00070928 1183.53 9.408E-05 151.75 228.16 94.27 114.99 172.84 491.27 69.79 191.75 Data Publisher Name Google - Global Google - US MSN - Global MSN - US Overture - Global Overture - US Yahoo - US Grand Total Volume of Sum of Total Sum of Clicks Sum of Impressions Bookings Sum of Amount Cost 72895 1808326 797 929549.8 120946.712 192109 3855689 1550 1745481.8 353640.5989 11217 139979 129 145524.25 12160.36244 10808 170120 140 181549.8 16098.48741 60899 17898727 372 430084.7 64295.86214 1 19323 17062488 289 347433.25 141976.0745 45598 933345 662 882288.95 46197.82462 512849 41868674 3939 4661912.55 755315.922 Average Cost Per Click (CPC) Click Through Rate (CTR) Transaction Conversion Rate (TCR) Sum of Net Revenue Retum on Ad Spent (ROA) Revenue Per Transaction Probability of Cost/Booki Booking ng Publisher Name Google - Global Google - US MSN - Global MSN - US Overture - Global Overture - US Yahoo - US Grand Total 1.66 1.84 1.08 1.49 1.06 1.19 1.01 1.47 0.040 0.050 0.080 0.064 0.003 0.007 0.049 0.012 0.011 0.008 0.012 0.013 0.006 0.002 0.015 0.008 808603.09 139184 1.20 133363.89 165451.31 365788.84 205457.18 83609 1.13 3906596.63 6.69 3.94 10.97 10.28 5.69 1.45 18.10 5.17 1166.31 0.00044074 1126.12 0.000402 1128.09 0.00092157 1296.78 0.00082295 1156.14 2.0784E-05 1202.19 1.6938E-05 1332.76 0.00070928 1183.53 9.408E-05 151.75 228.16 94.27 114.99 172.84 491.27 69.79 191.75
Step by Step Solution
There are 3 Steps involved in it

Get step-by-step solutions from verified subject matter experts