

Question: 5. Graphing demand for labor and computing the optimal quantity A company operates in a pricetaker market, selling each unit of output for a price
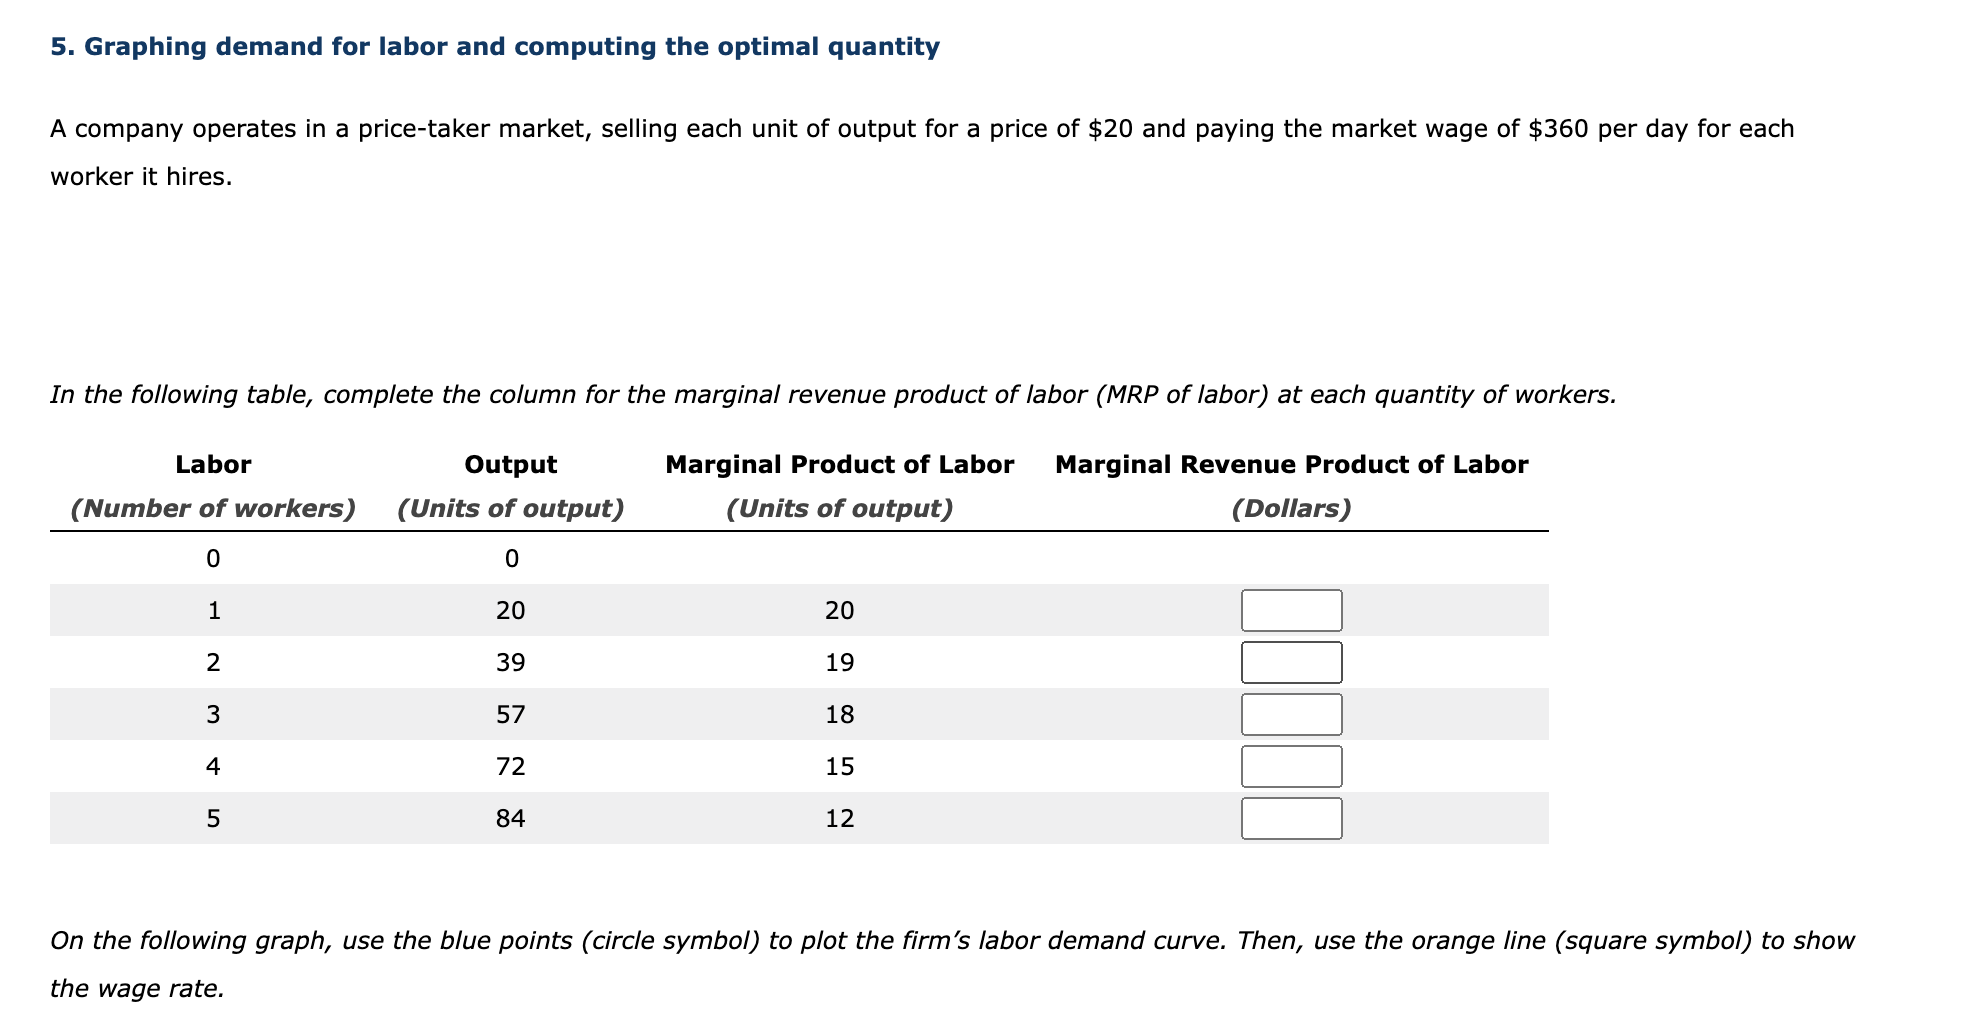


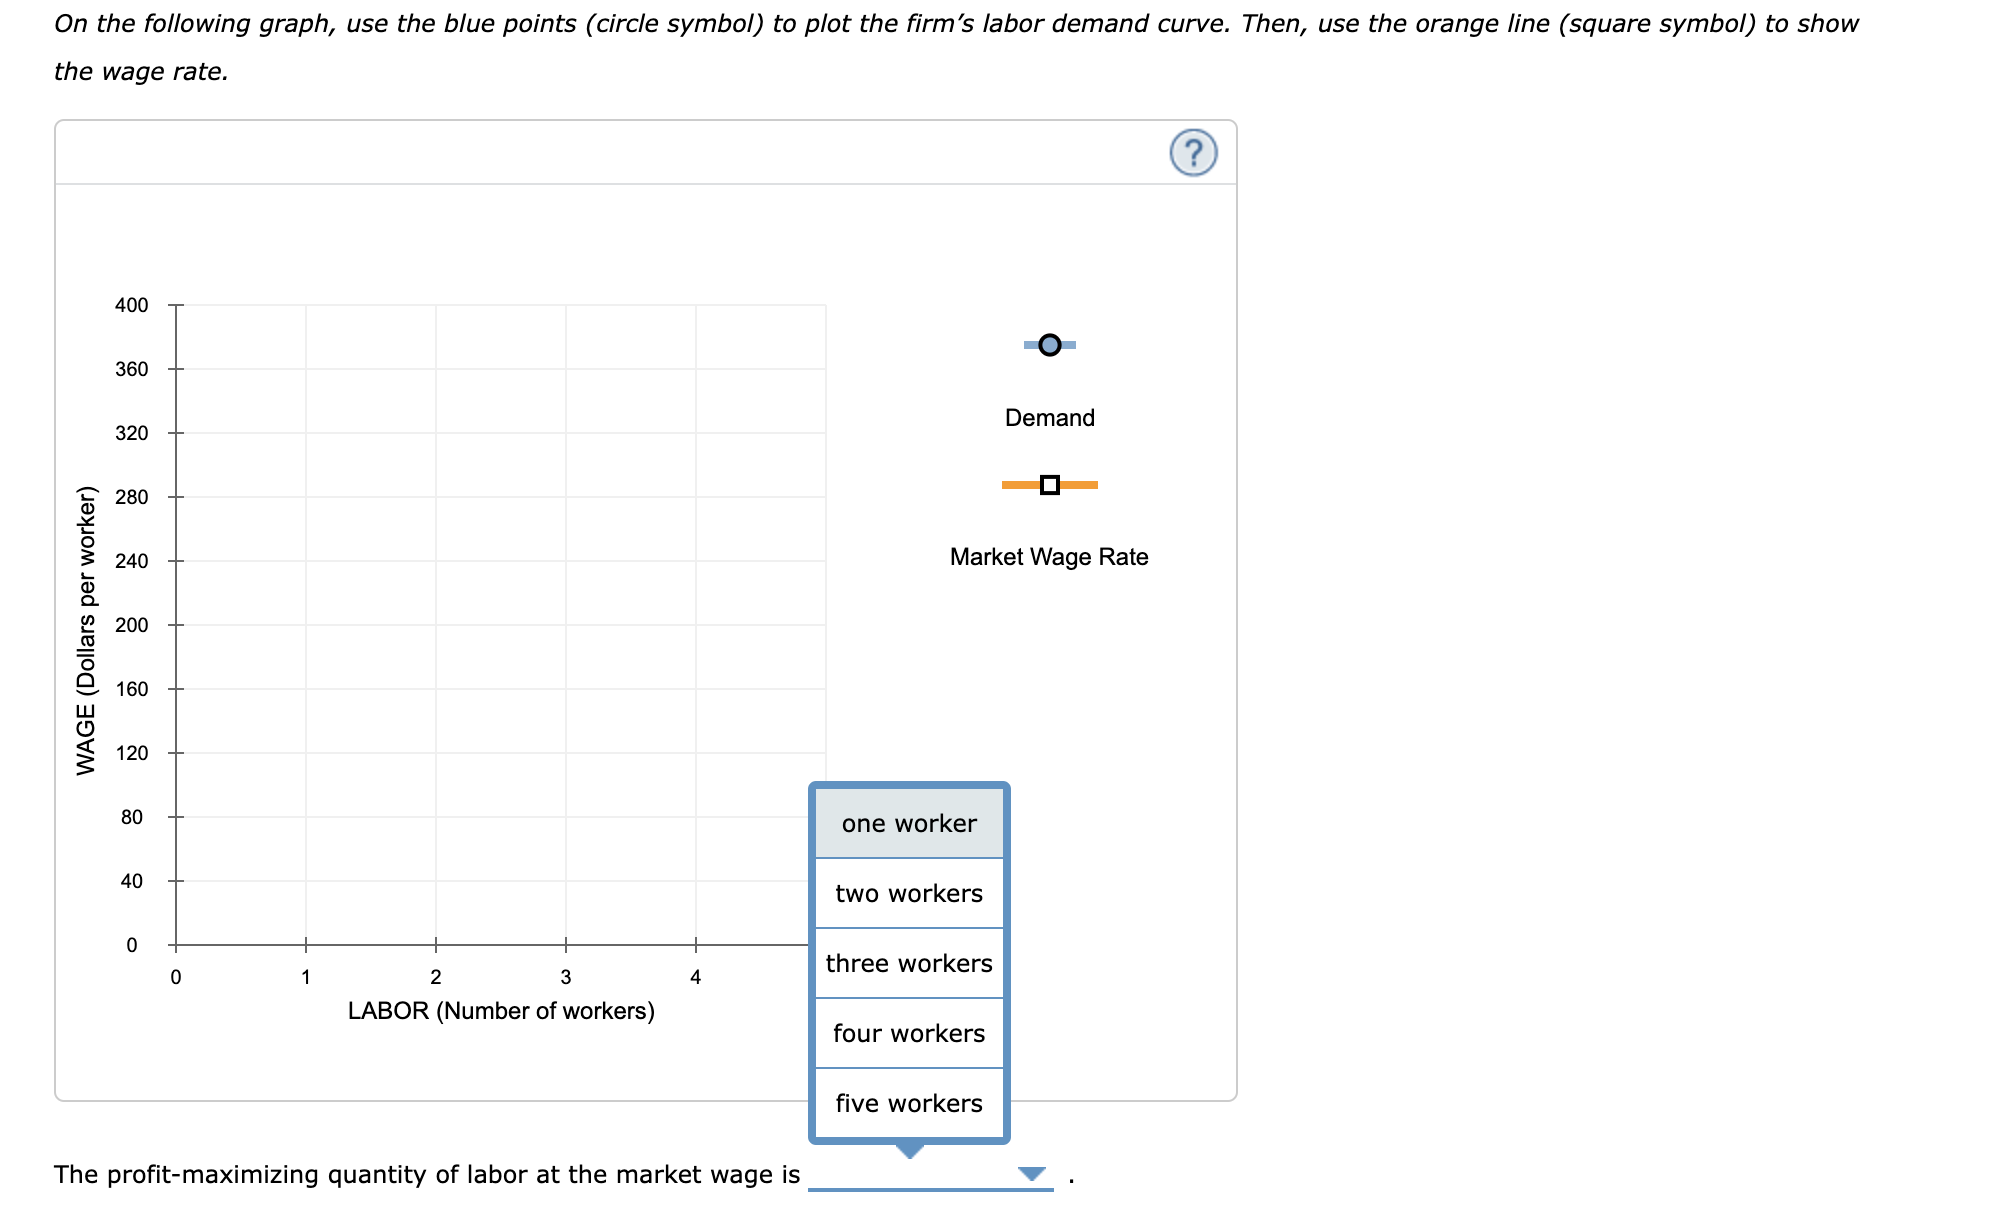
5. Graphing demand for labor and computing the optimal quantity A company operates in a pricetaker market, selling each unit of output for a price of $20 and paying the market wage of $360 per day for each worker it hires. In the following table, complete the column for the marginal revenue product of labor (MRP of labor) at each quantity of workers. Labor Output Marginal Product of Labor Marginal Revenue Product of Labor (Number of workers) (Units of output) (Units of output) (Dollars) 0 0 1 20 20 2 39 19 3 57 18 4 72 15 5 84 12 On the following graph, use the blue points (circle symbol) to plot the firm's labor demand curve. Then, use the orange line (square symbol) to show the wage rate. On the following graph, use the blue points (circle symbol) to plot the firm's labor demand curve. Then, use the orange line (square symbol) to show the wage rate. 400 O 360 Demand 320 280 240 Market Wage Rate 200 WAGE (Dollars per worker) 160 120 80 one worker 40 two workers 0 three workers 0 2 3 LABOR (Number of workers) four workers five workers The profit-maximizing quantity of labor at the market wage is
Step by Step Solution
There are 3 Steps involved in it

Get step-by-step solutions from verified subject matter experts