

Question: 5. In cach batch of samples, a control sample will be inserted immediately after each 10 samples. The control sample will be analysed exactly as
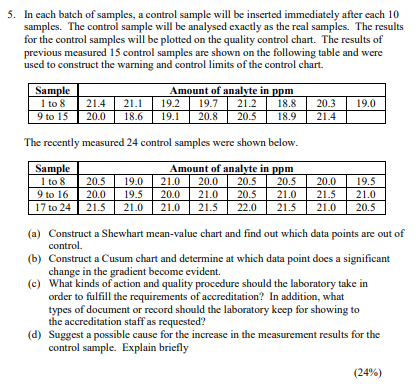
5. In cach batch of samples, a control sample will be inserted immediately after each 10 samples. The control sample will be analysed exactly as the real samples. The results for the control samples will be plotted on the quality control chart. The results of previous measured 15 control samples are shown on the following table and were used to construct the warning and control limits of the control chart. Sample 1 to 8 21.4 9 to 15 20.0 Amount of analyte in ppm 19.2 19.7 21.2 18.8 19.1 20.8 20.5 18.9 21.1 18.6 19.0 20.3 21.4 The recently measured 24 control samples were shown below. Sample 1 to 8 9 to 16 17 to 24 20.5 20.0 21.5 19.0 19.5 21.0 Amount of analyte in ppm 21.0 20.0 20.5 20.5 20.0 21.0 20.5 21.0 21.0 21.5 22.0 21.5 20.0 21.5 21.0 19.5 21.0 20.5 (a) Construct a Shewhart mean-value chart and find out which data points are out of control. (b) Construct a Cusum chart and determine at which data point does a significant change in the gradient become evident. (c) What kinds of action and quality procedure should the laboratory take in order to fulfill the requirements of accreditation? In addition, what types of document or record should the laboratory keep for showing to the accreditation staff as requested? (d) Suggest a possible cause for the increase in the measurement results for the control sample. Explain briefly (24%)
Step by Step Solution
There are 3 Steps involved in it

Get step-by-step solutions from verified subject matter experts