

Question: 5. In the illustration below, the dashed line represents the population mean and the red lines represent the boundaries of the region of rejection (based
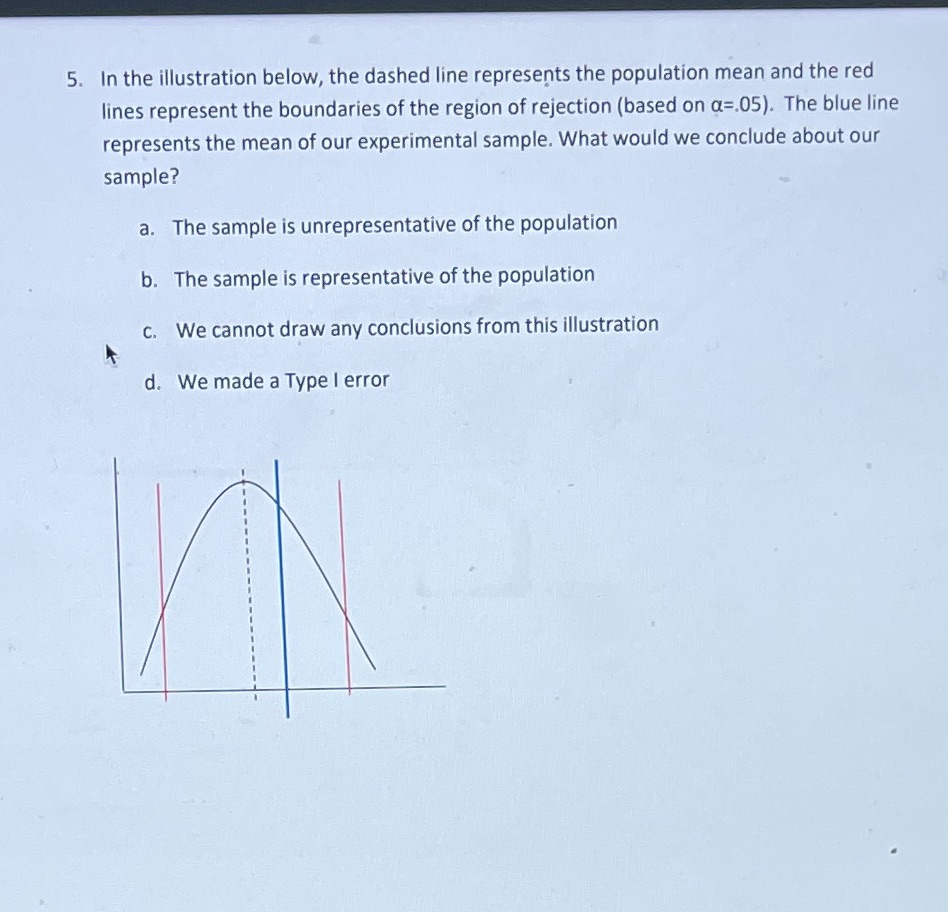
5. In the illustration below, the dashed line represents the population mean and the red lines represent the boundaries of the region of rejection (based on a=.05). The blue line represents the mean of our experimental sample. What would we conclude about our sample? a. The sample is unrepresentative of the population b. The sample is representative of the population c. We cannot draw any conclusions from this illustration A d. We made a Type I error
Step by Step Solution
There are 3 Steps involved in it
1 Expert Approved Answer
Step: 1 Unlock

Question Has Been Solved by an Expert!
Get step-by-step solutions from verified subject matter experts
Step: 2 Unlock
Step: 3 Unlock