

Question: 5. Mike is more risk-averse than Jacky. On a graph that shows Mike and Jacky's indifference curves, which of the following is true? Suppose that
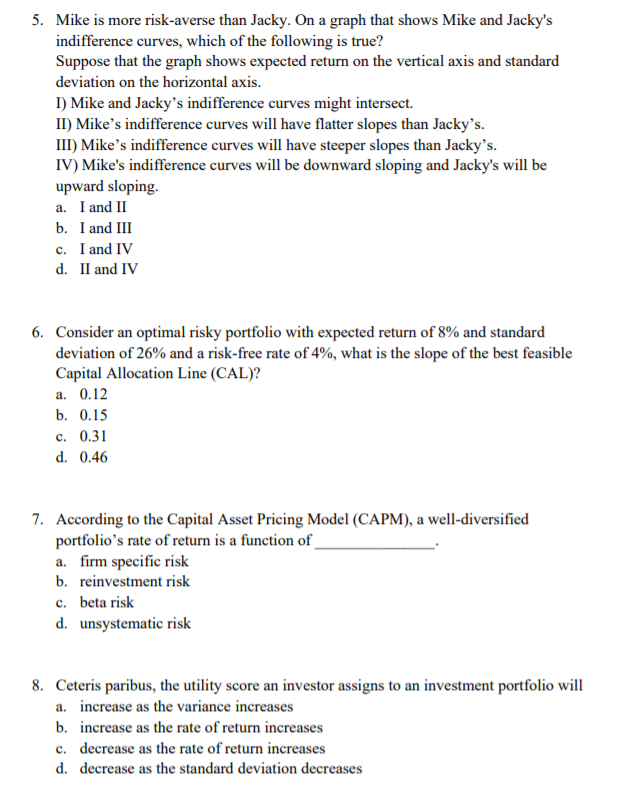
5. Mike is more risk-averse than Jacky. On a graph that shows Mike and Jacky's indifference curves, which of the following is true? Suppose that the graph shows expected return on the vertical axis and standard deviation on the horizontal axis. 1) Mike and Jacky's indifference curves might intersect. II) Mike's indifference curves will have flatter slopes than Jacky's. III) Mike's indifference curves will have steeper slopes than Jacky's. IV) Mike's indifference curves will be downward sloping and Jacky's will be upward sloping. a. I and II b. I and III c. I and IV d. II and IV 6. Consider an optimal risky portfolio with expected return of 8% and standard deviation of 26% and a risk-free rate of 4%, what is the slope of the best feasible Capital Allocation Line (CAL)? a. 0.12 b. 0.15 c. 0.31 d. 0.46 7. According to the Capital Asset Pricing Model (CAPM), a well-diversified portfolio's rate of return is a function of a. firm specific risk b. reinvestment risk c. beta risk d. unsystematic risk 8. Ceteris paribus, the utility score an investor assigns to an investment portfolio will a. increase as the variance increases b. increase as the rate of return increases c. decrease as the rate of return increases d. decrease as the standard deviation decreases
Step by Step Solution
There are 3 Steps involved in it

Get step-by-step solutions from verified subject matter experts