

Question: 5. Now we can write the following: = 10 where ck are the coefficients calculated above. Plot both the original data and the Fourier series
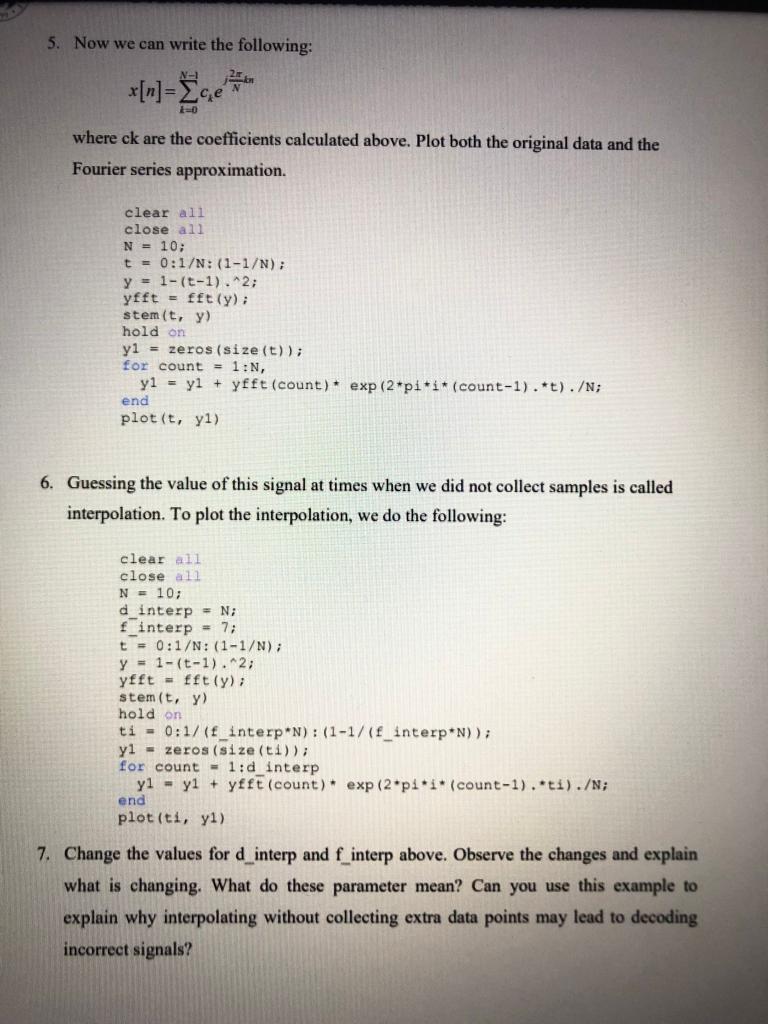
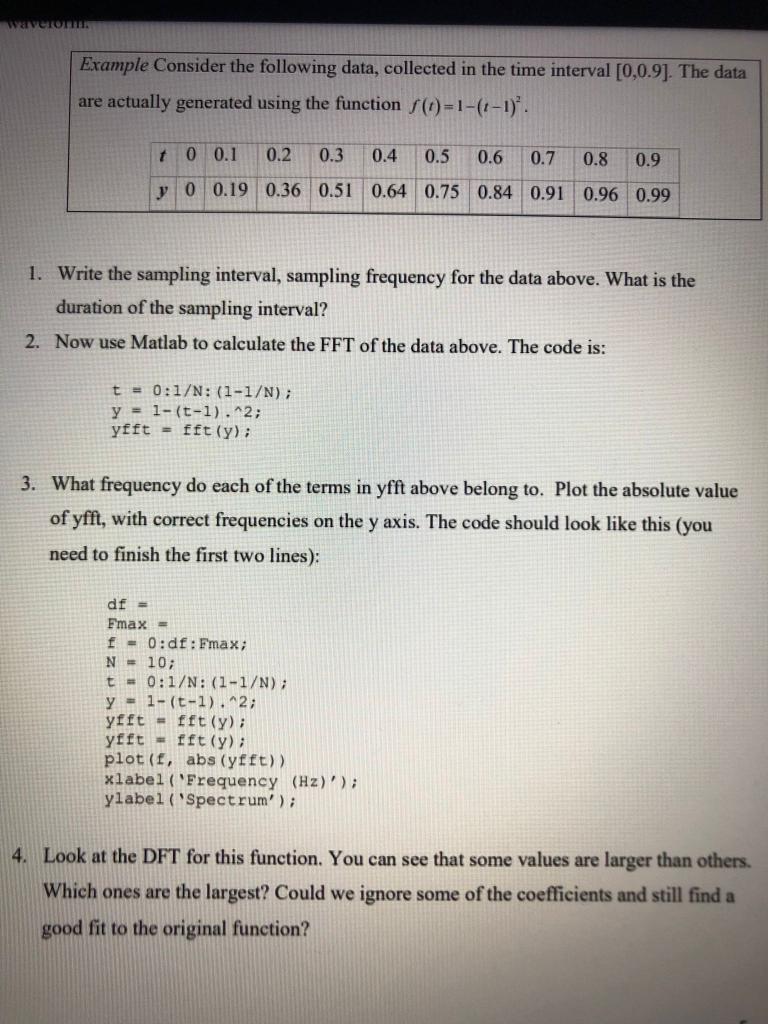
5. Now we can write the following: = 10 where ck are the coefficients calculated above. Plot both the original data and the Fourier series approximation. clear all close all N = 10; t = 0:1/N: (1-1/N); y = 1- (t-1)^2; yfft = fft (y) : stem(t, y) hold on y1 = zeros(size (t)); for count = 1:N, yl = y1 + yfft (count) exp (2*pi*i* (count-1).*t)./N; end plot(t, y1) 6. Guessing the value of this signal at times when we did not collect samples is called interpolation. To plot the interpolation, we do the following: clear all close all N = 10; d_interp = N; f_interp = 7; t = 0:1/N: (1-1/N): y = 1- (t-1)^2; yfft = fft (y); stem(t, y) hold on ti = 0:1/(f_interp*N): (1-1/(f_interp*N)); yl - zeros(size (ti)); for count = 1:d_interp y1 - y1 + yfft (count) exp (2-pi*i*(count-1).ti)./N; end plot(ti, yl) 7. Change the values for d_interp and f_interp above. Observe the changes and explain what is changing. What do these parameter mean? Can you use this example to explain why interpolating without collecting extra data points may lead to decoding incorrect signals? WIOS Example Consider the following data, collected in the time interval [0,0.9). The data are actually generated using the function (t)=1-(1-1). t 0 0.1 0.2 0.3 0.4 0.5 0.6 0.7 0.8 0.9 y 0 0.19 0.36 0.51 0.64 0.75 0.84 0.91 0.96 0.99 1. Write the sampling interval, sampling frequency for the data above. What is the duration of the sampling interval? 2. Now use Matlab to calculate the FFT of the data above. The code is: t = 0:1/N: (1-1/N); y = 1-(t-1).^2; yfft - fft (y); 3. What frequency do each of the terms in yfft above belong to. Plot the absolute value of yfft, with correct frequencies on the y axis. The code should look like this (you need to finish the first two lines): df = Fmax = f - 0:df: Fmax; N = 10; t T 0:1/N: (1-1/N); y = 1- (t-1)^2; yfft - fft (y); yfft = fft (y); plot (f, abs (yfft)) xlabel ("Frequency (Hz)'); ylabel ("Spectrum'); 4. Look at the DFT for this function. You can see that some values are larger than others. Which ones are the largest? Could we ignore some of the coefficients and still find a good fit to the original function
Step by Step Solution
There are 3 Steps involved in it

Get step-by-step solutions from verified subject matter experts